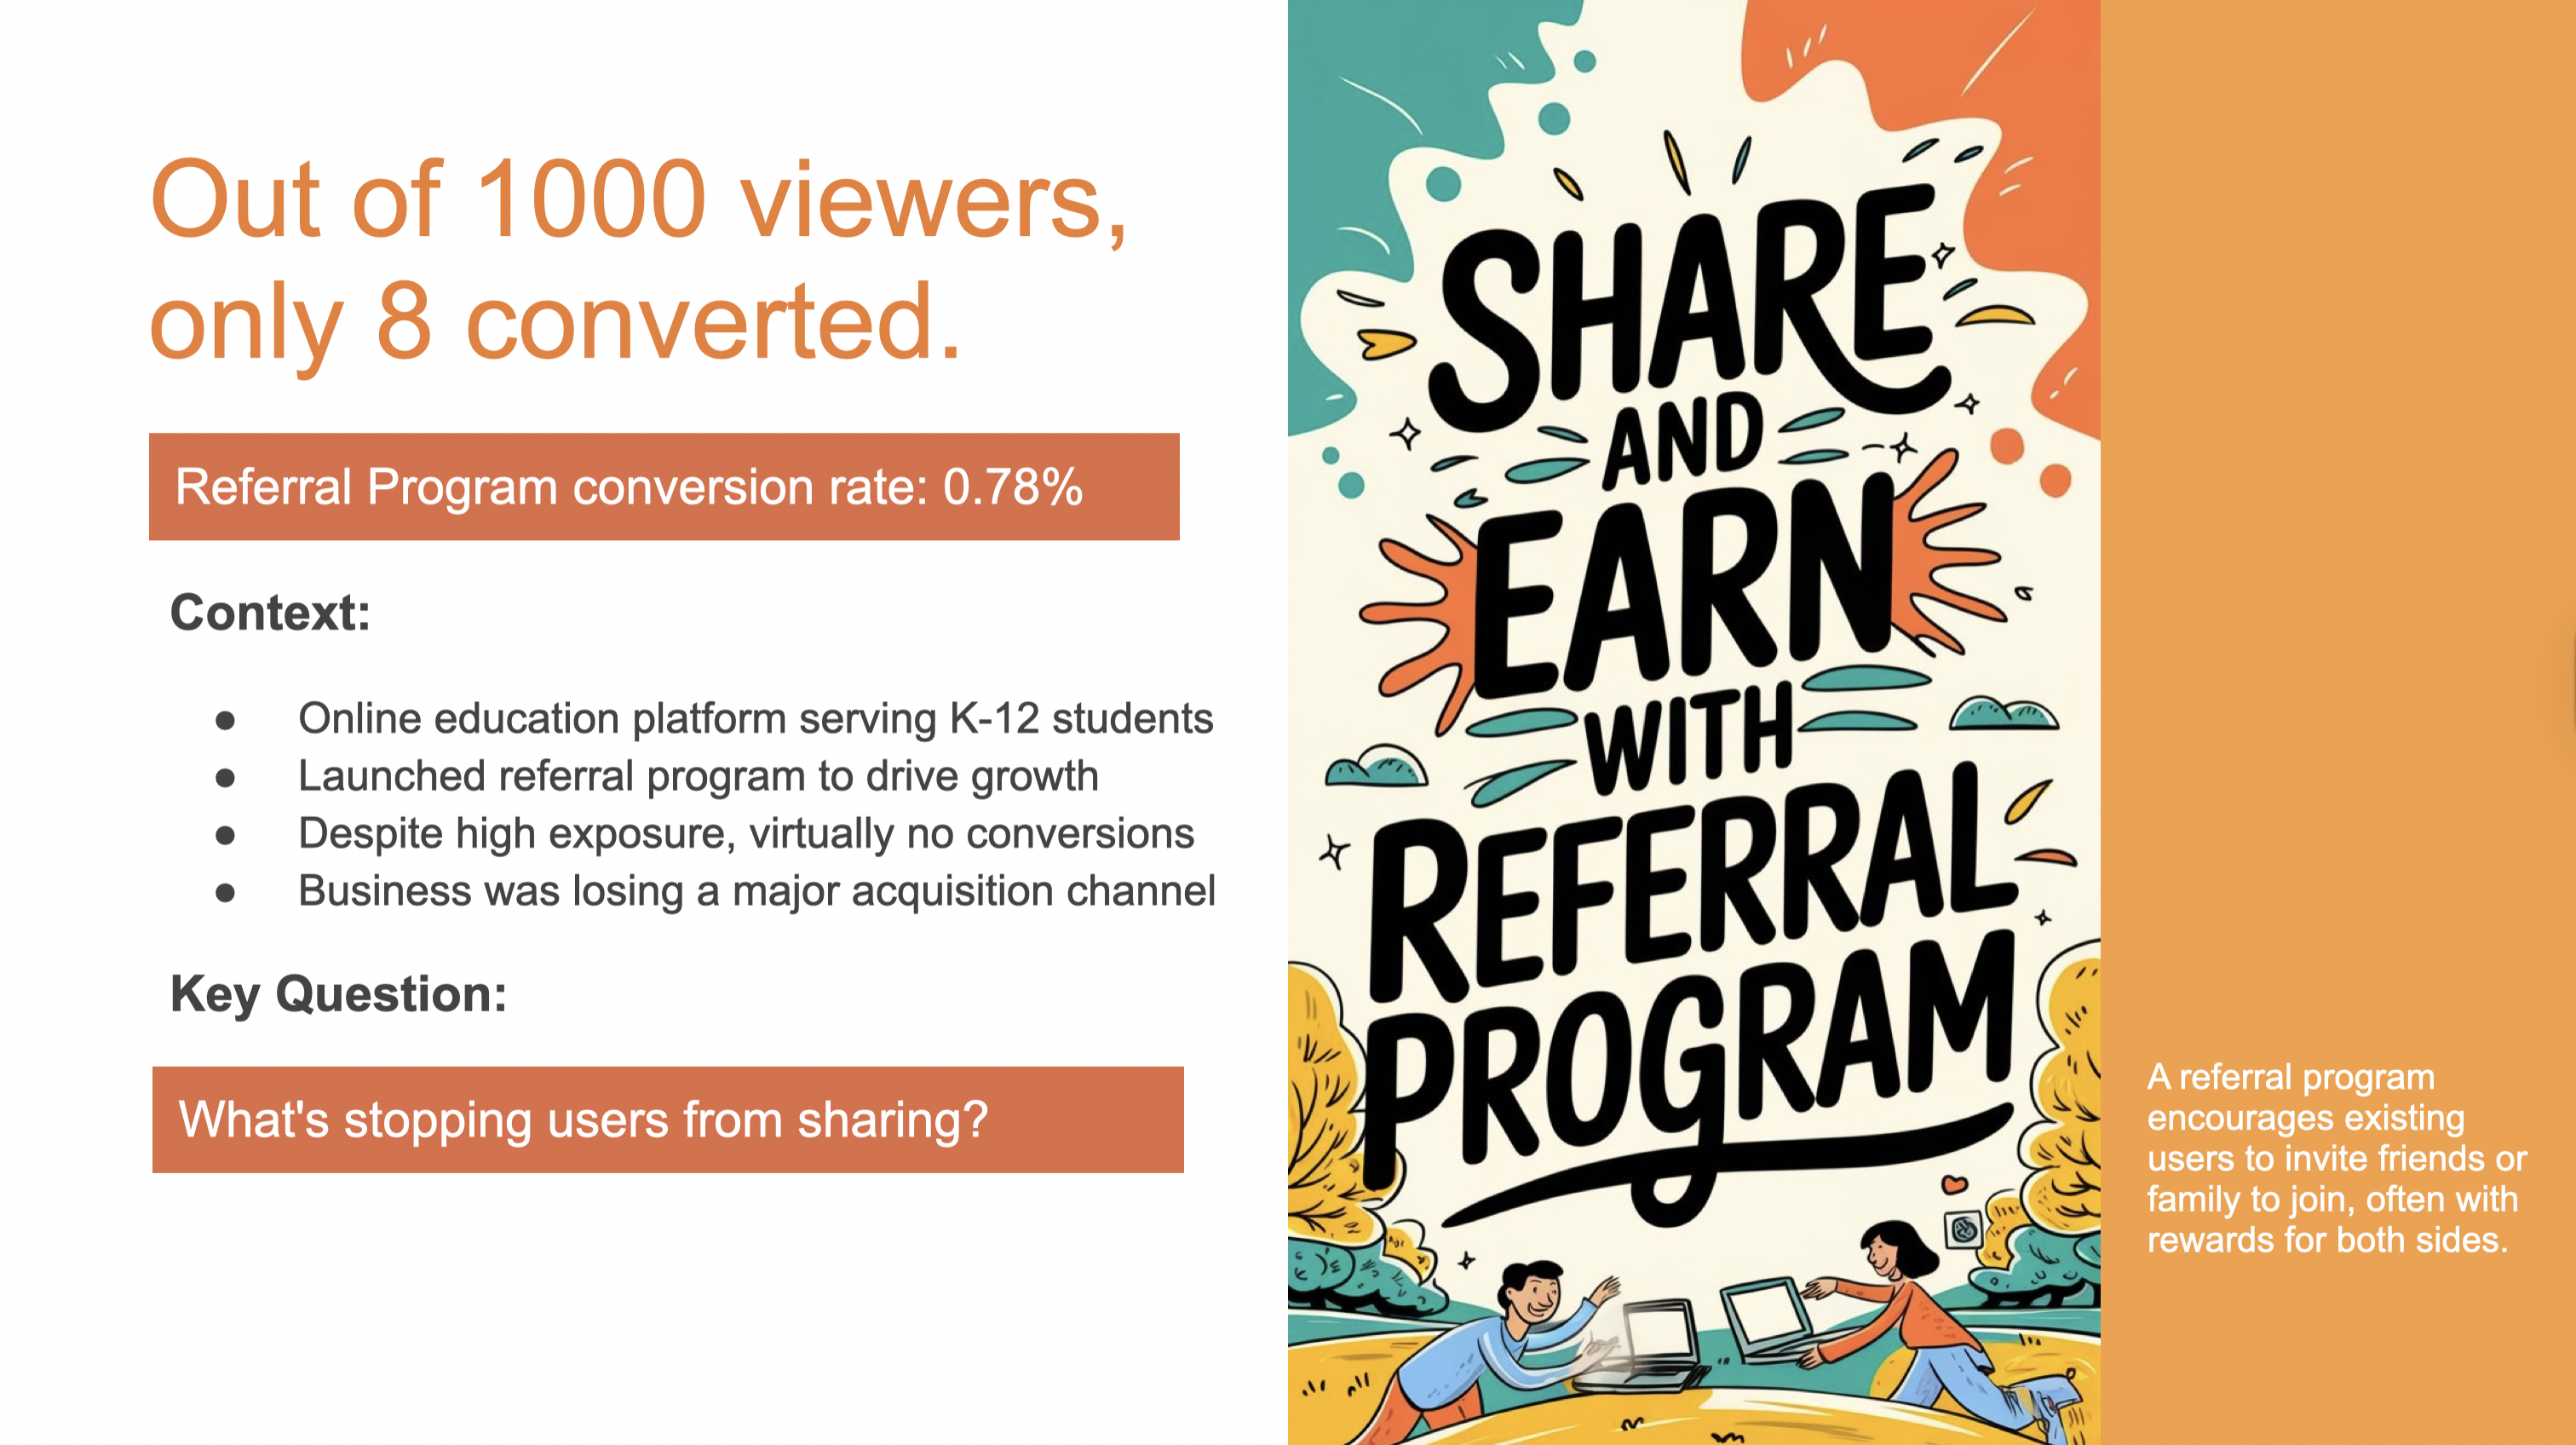
Problem
Research Approach
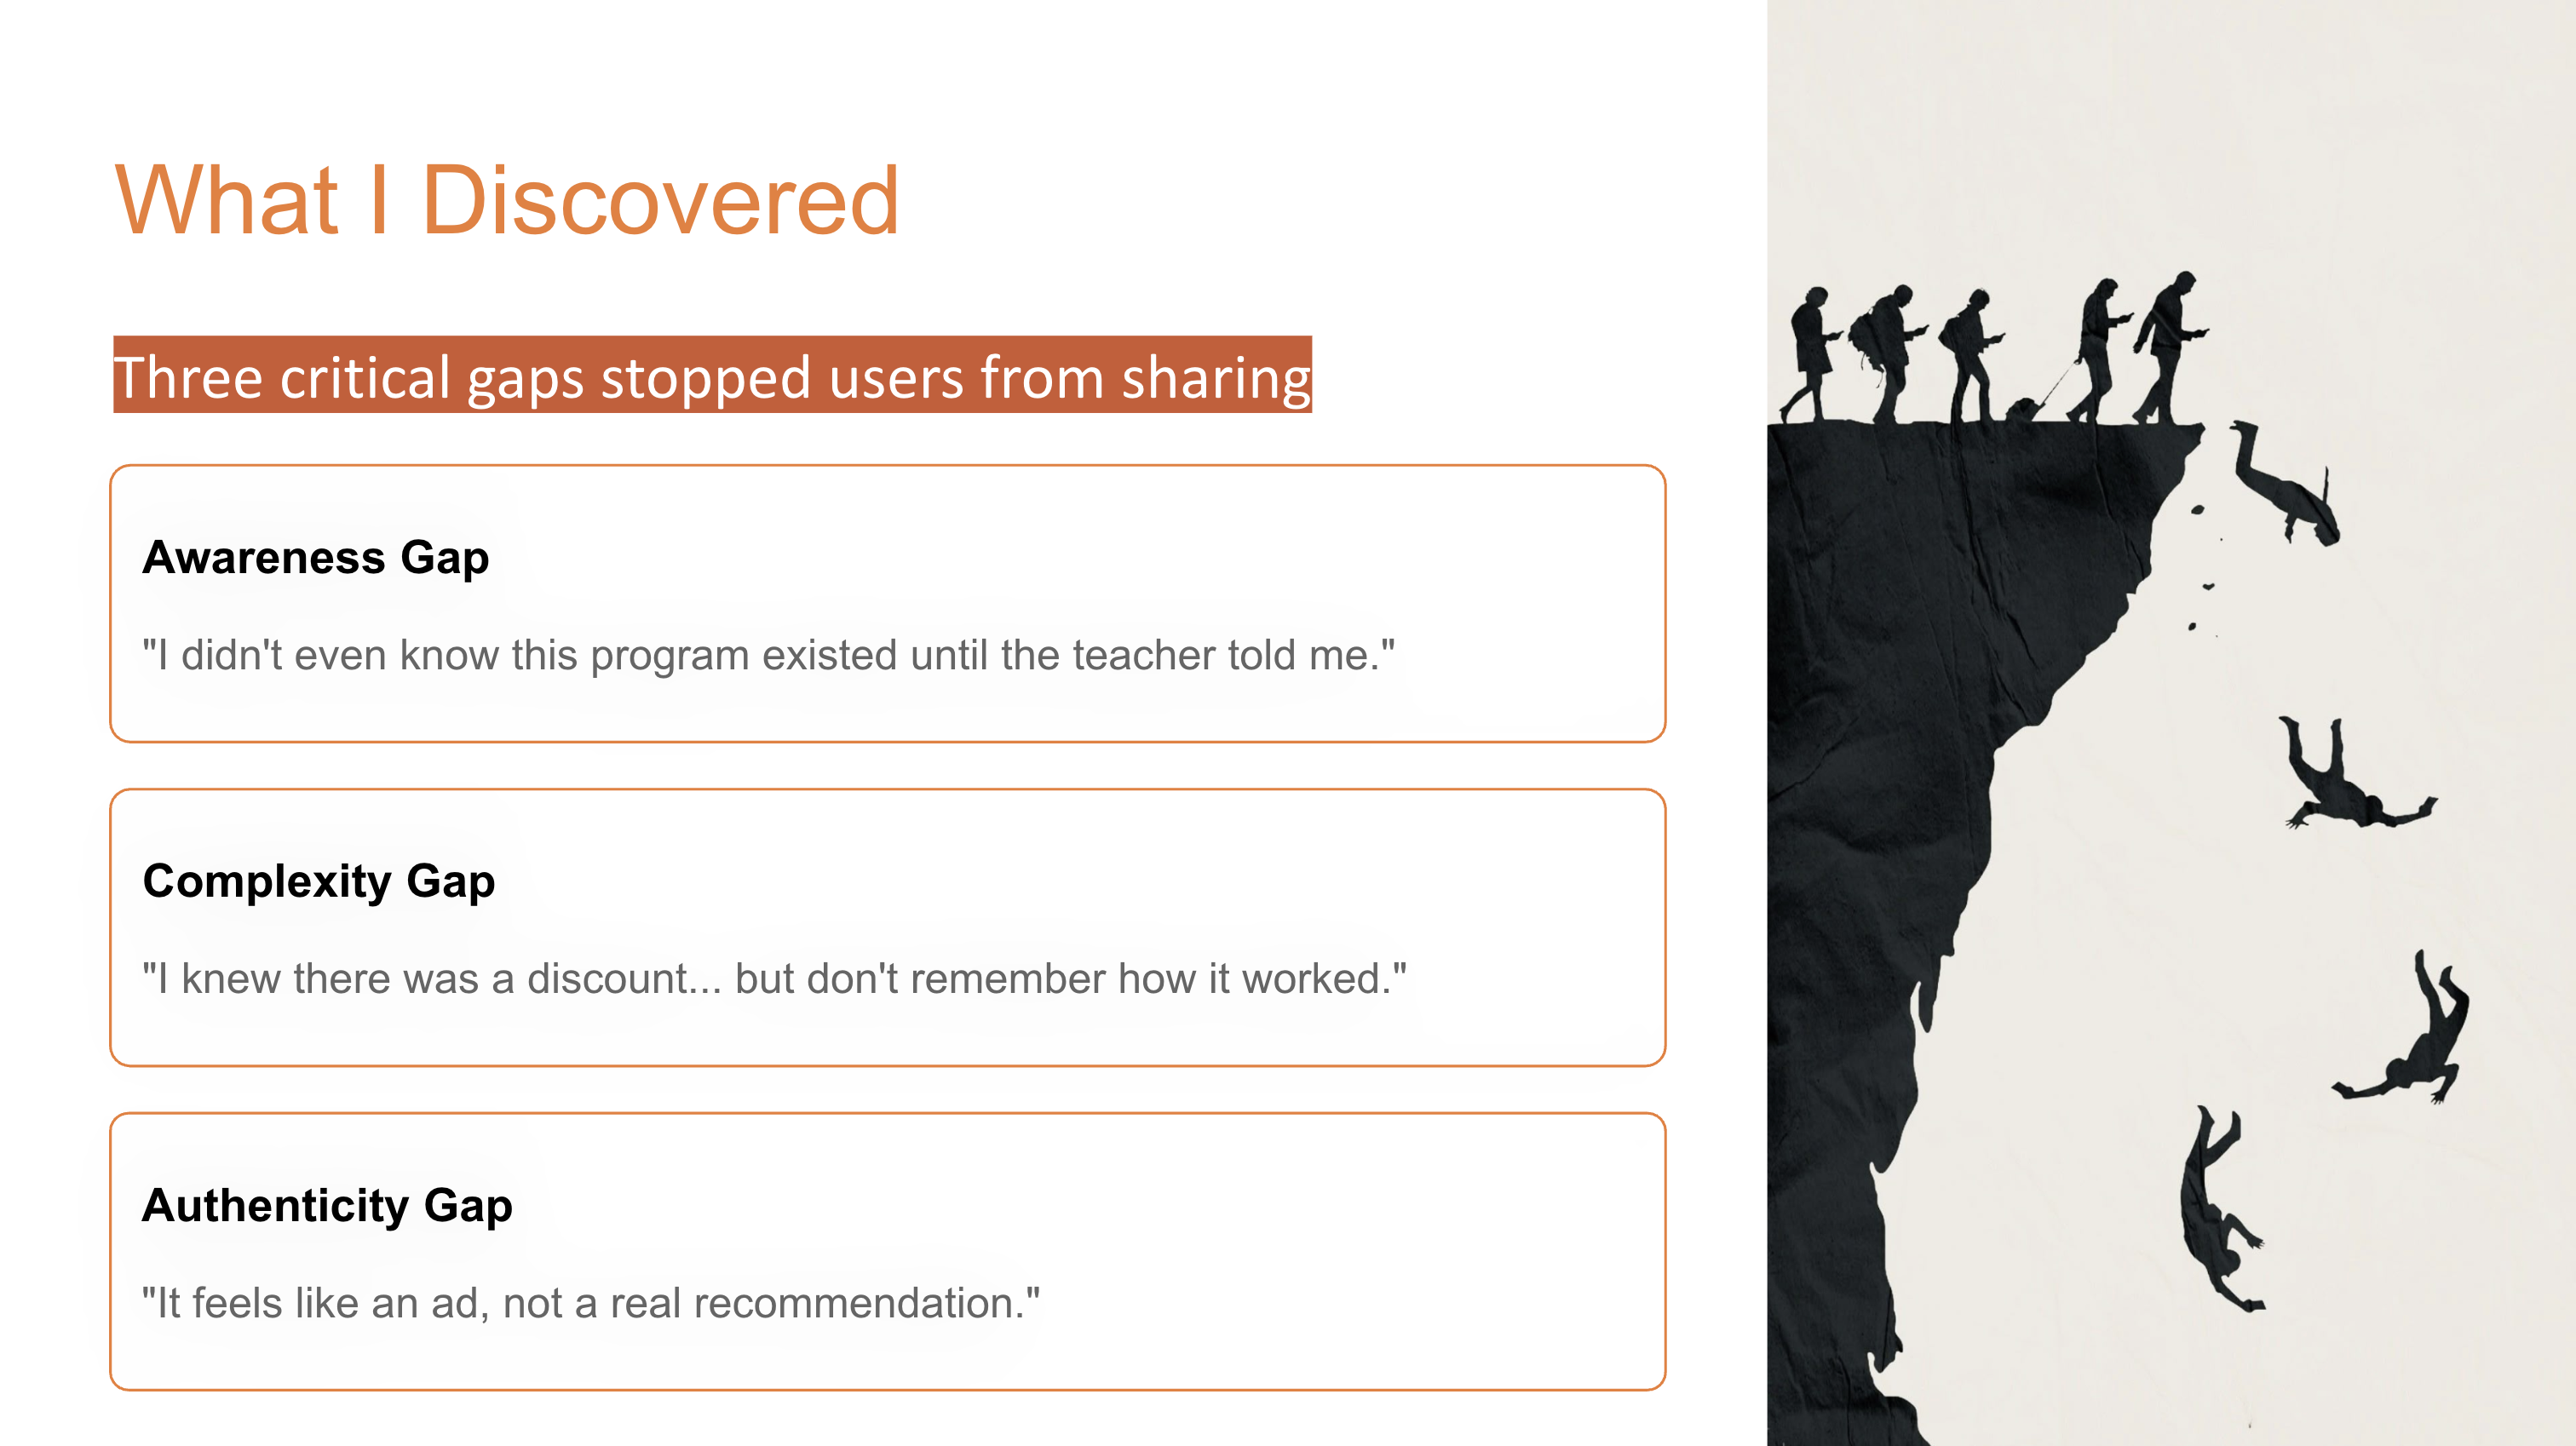
Three Critical Gaps
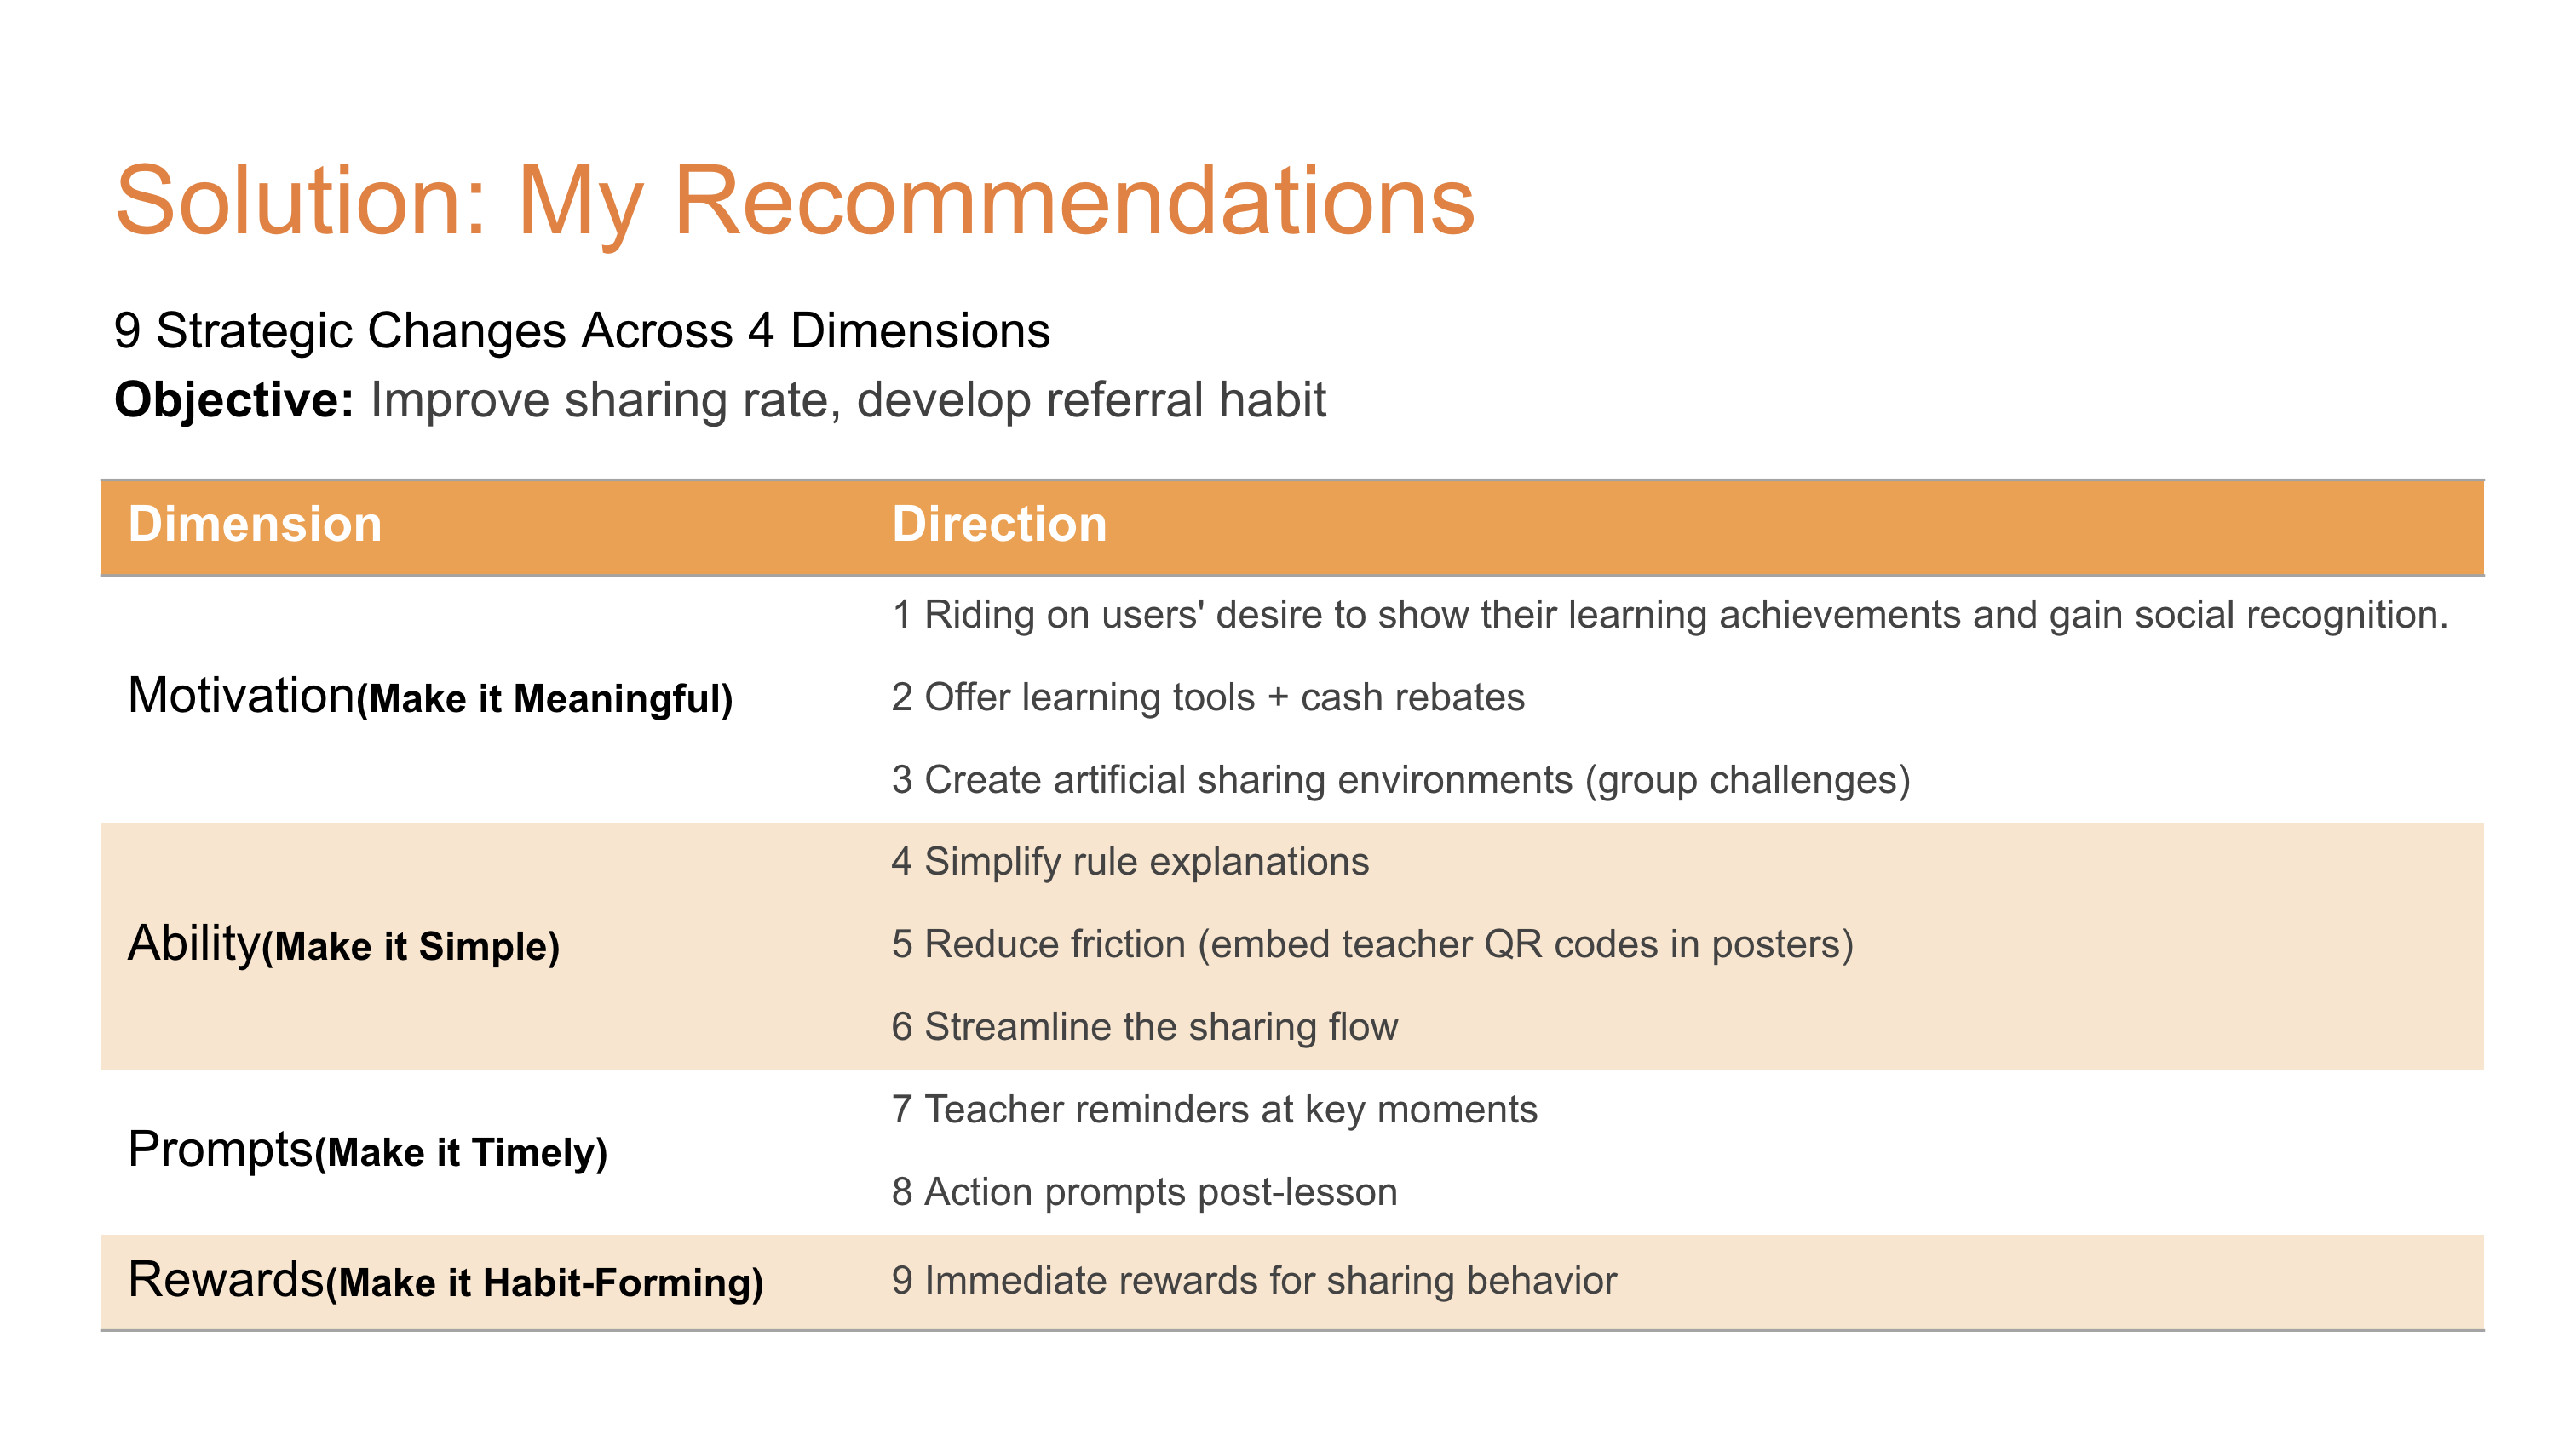
Solution
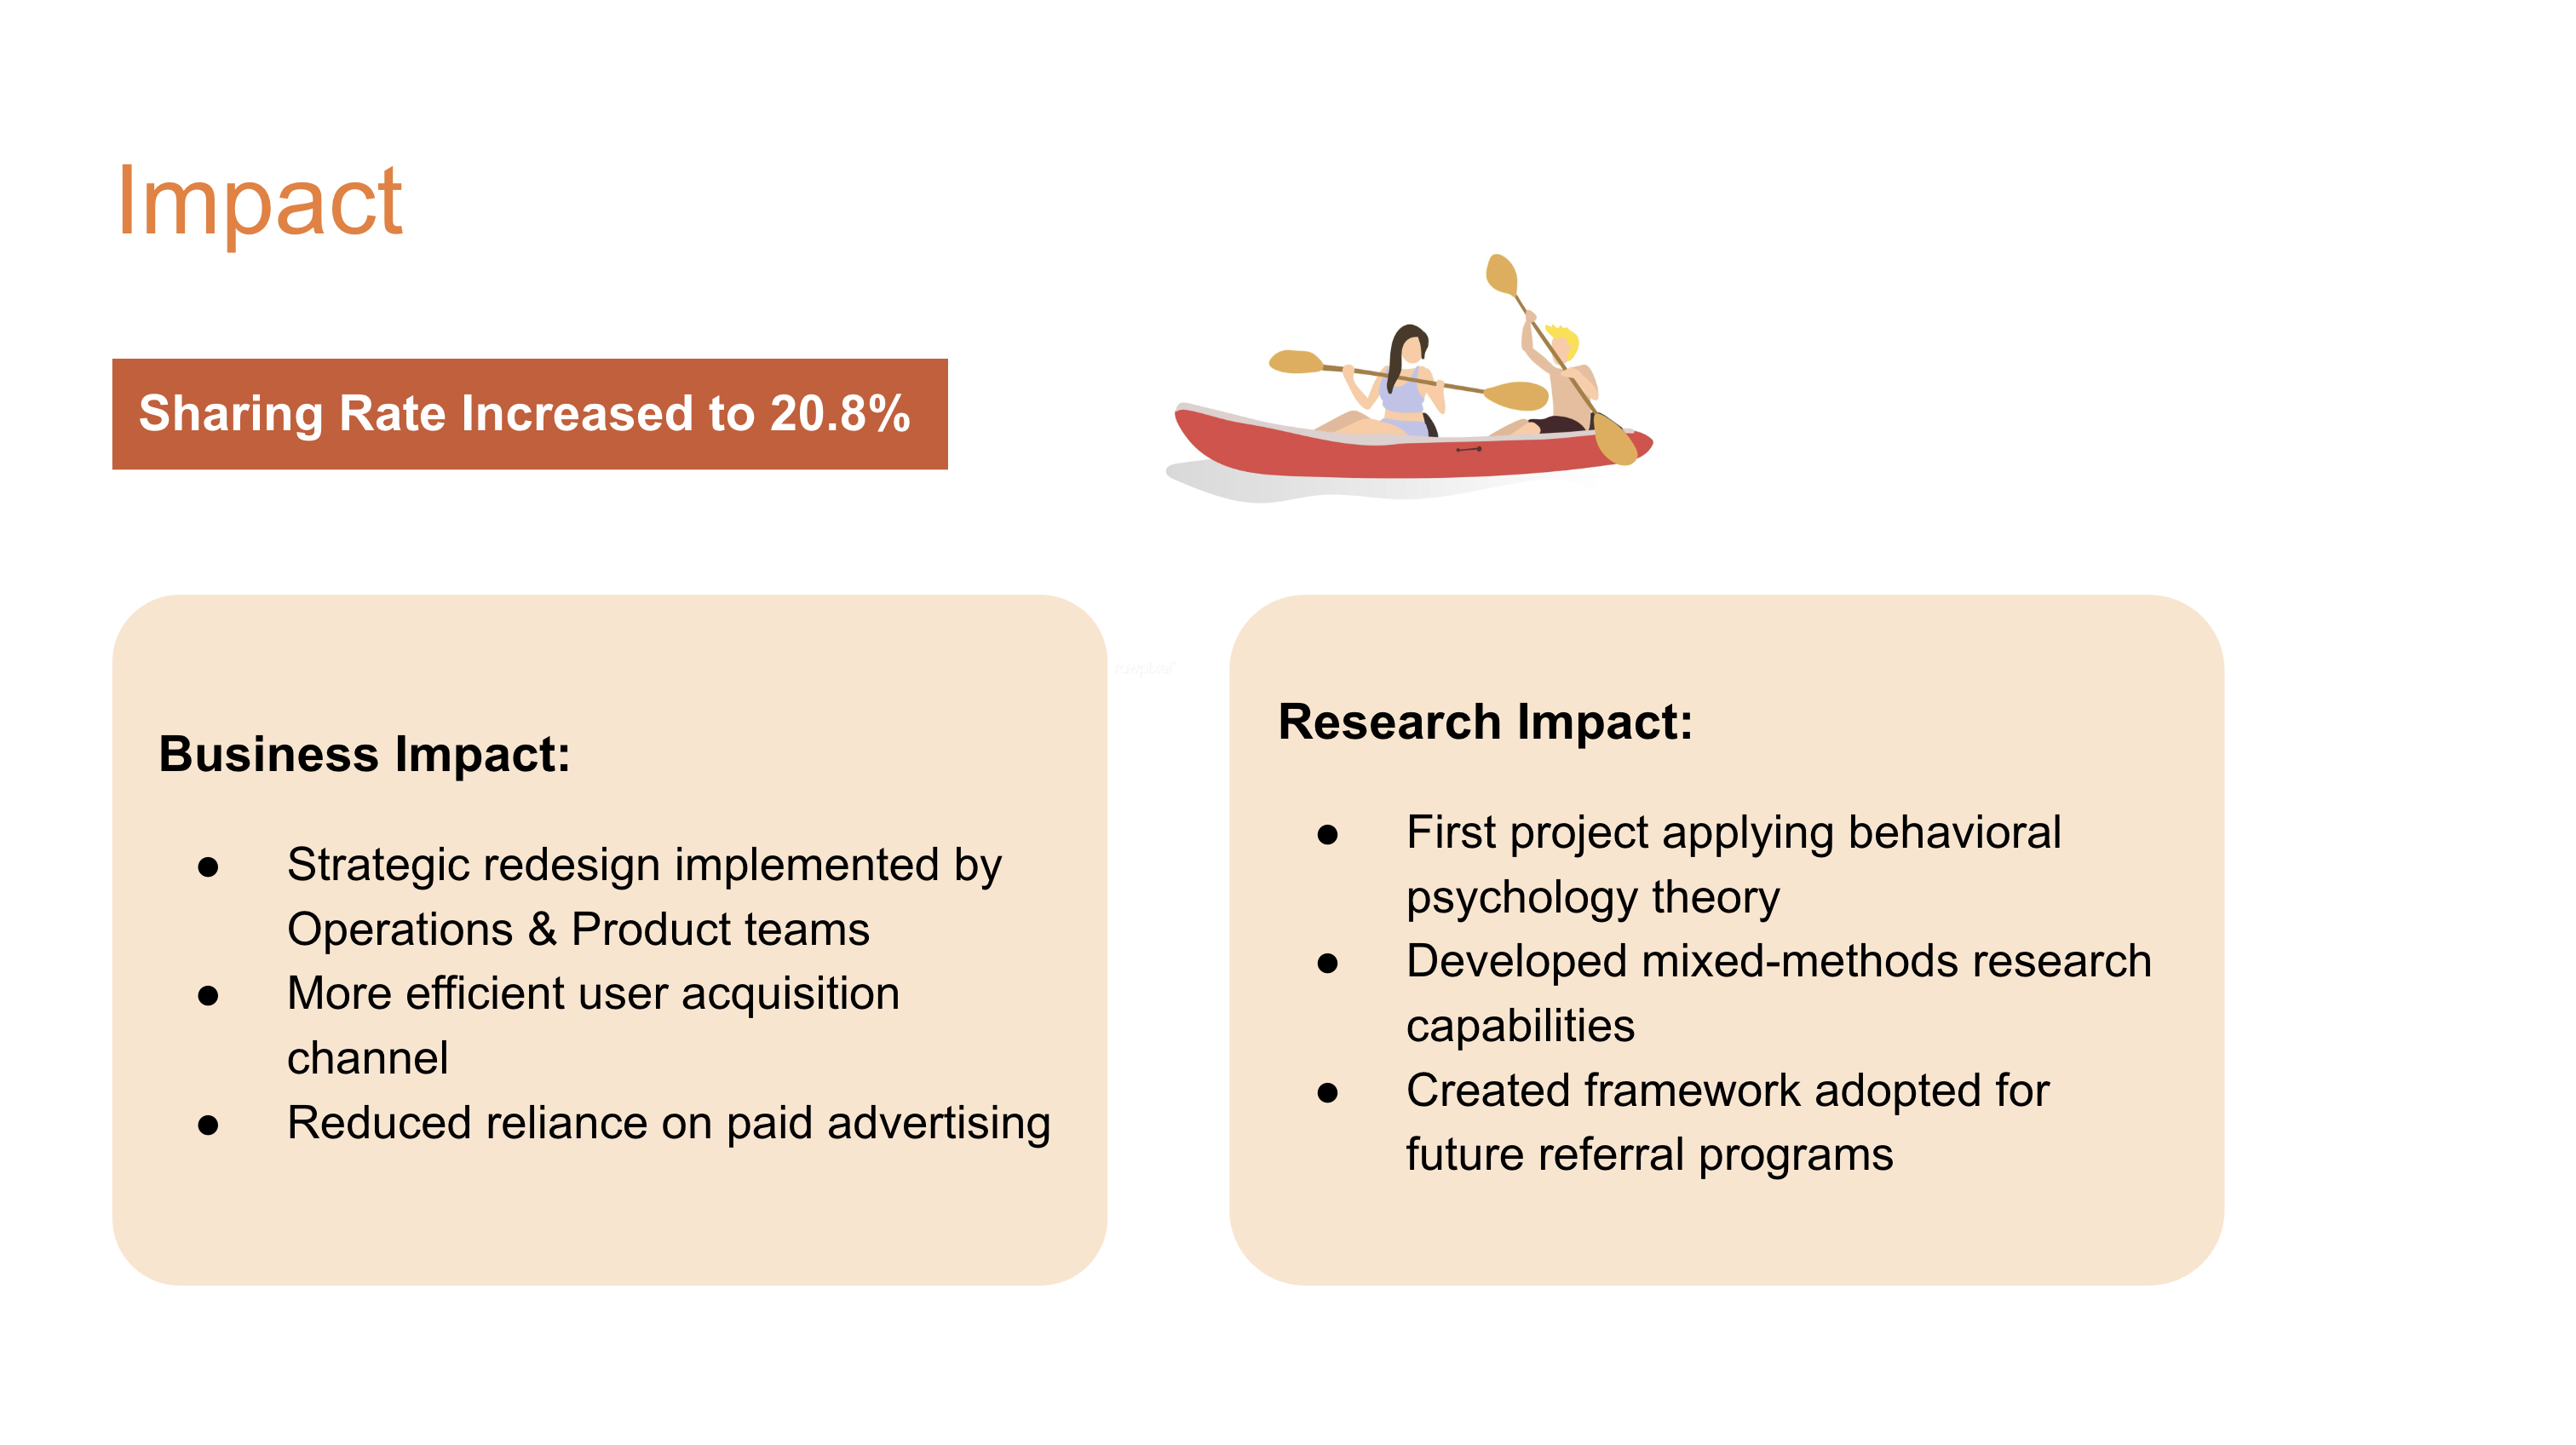
Impact
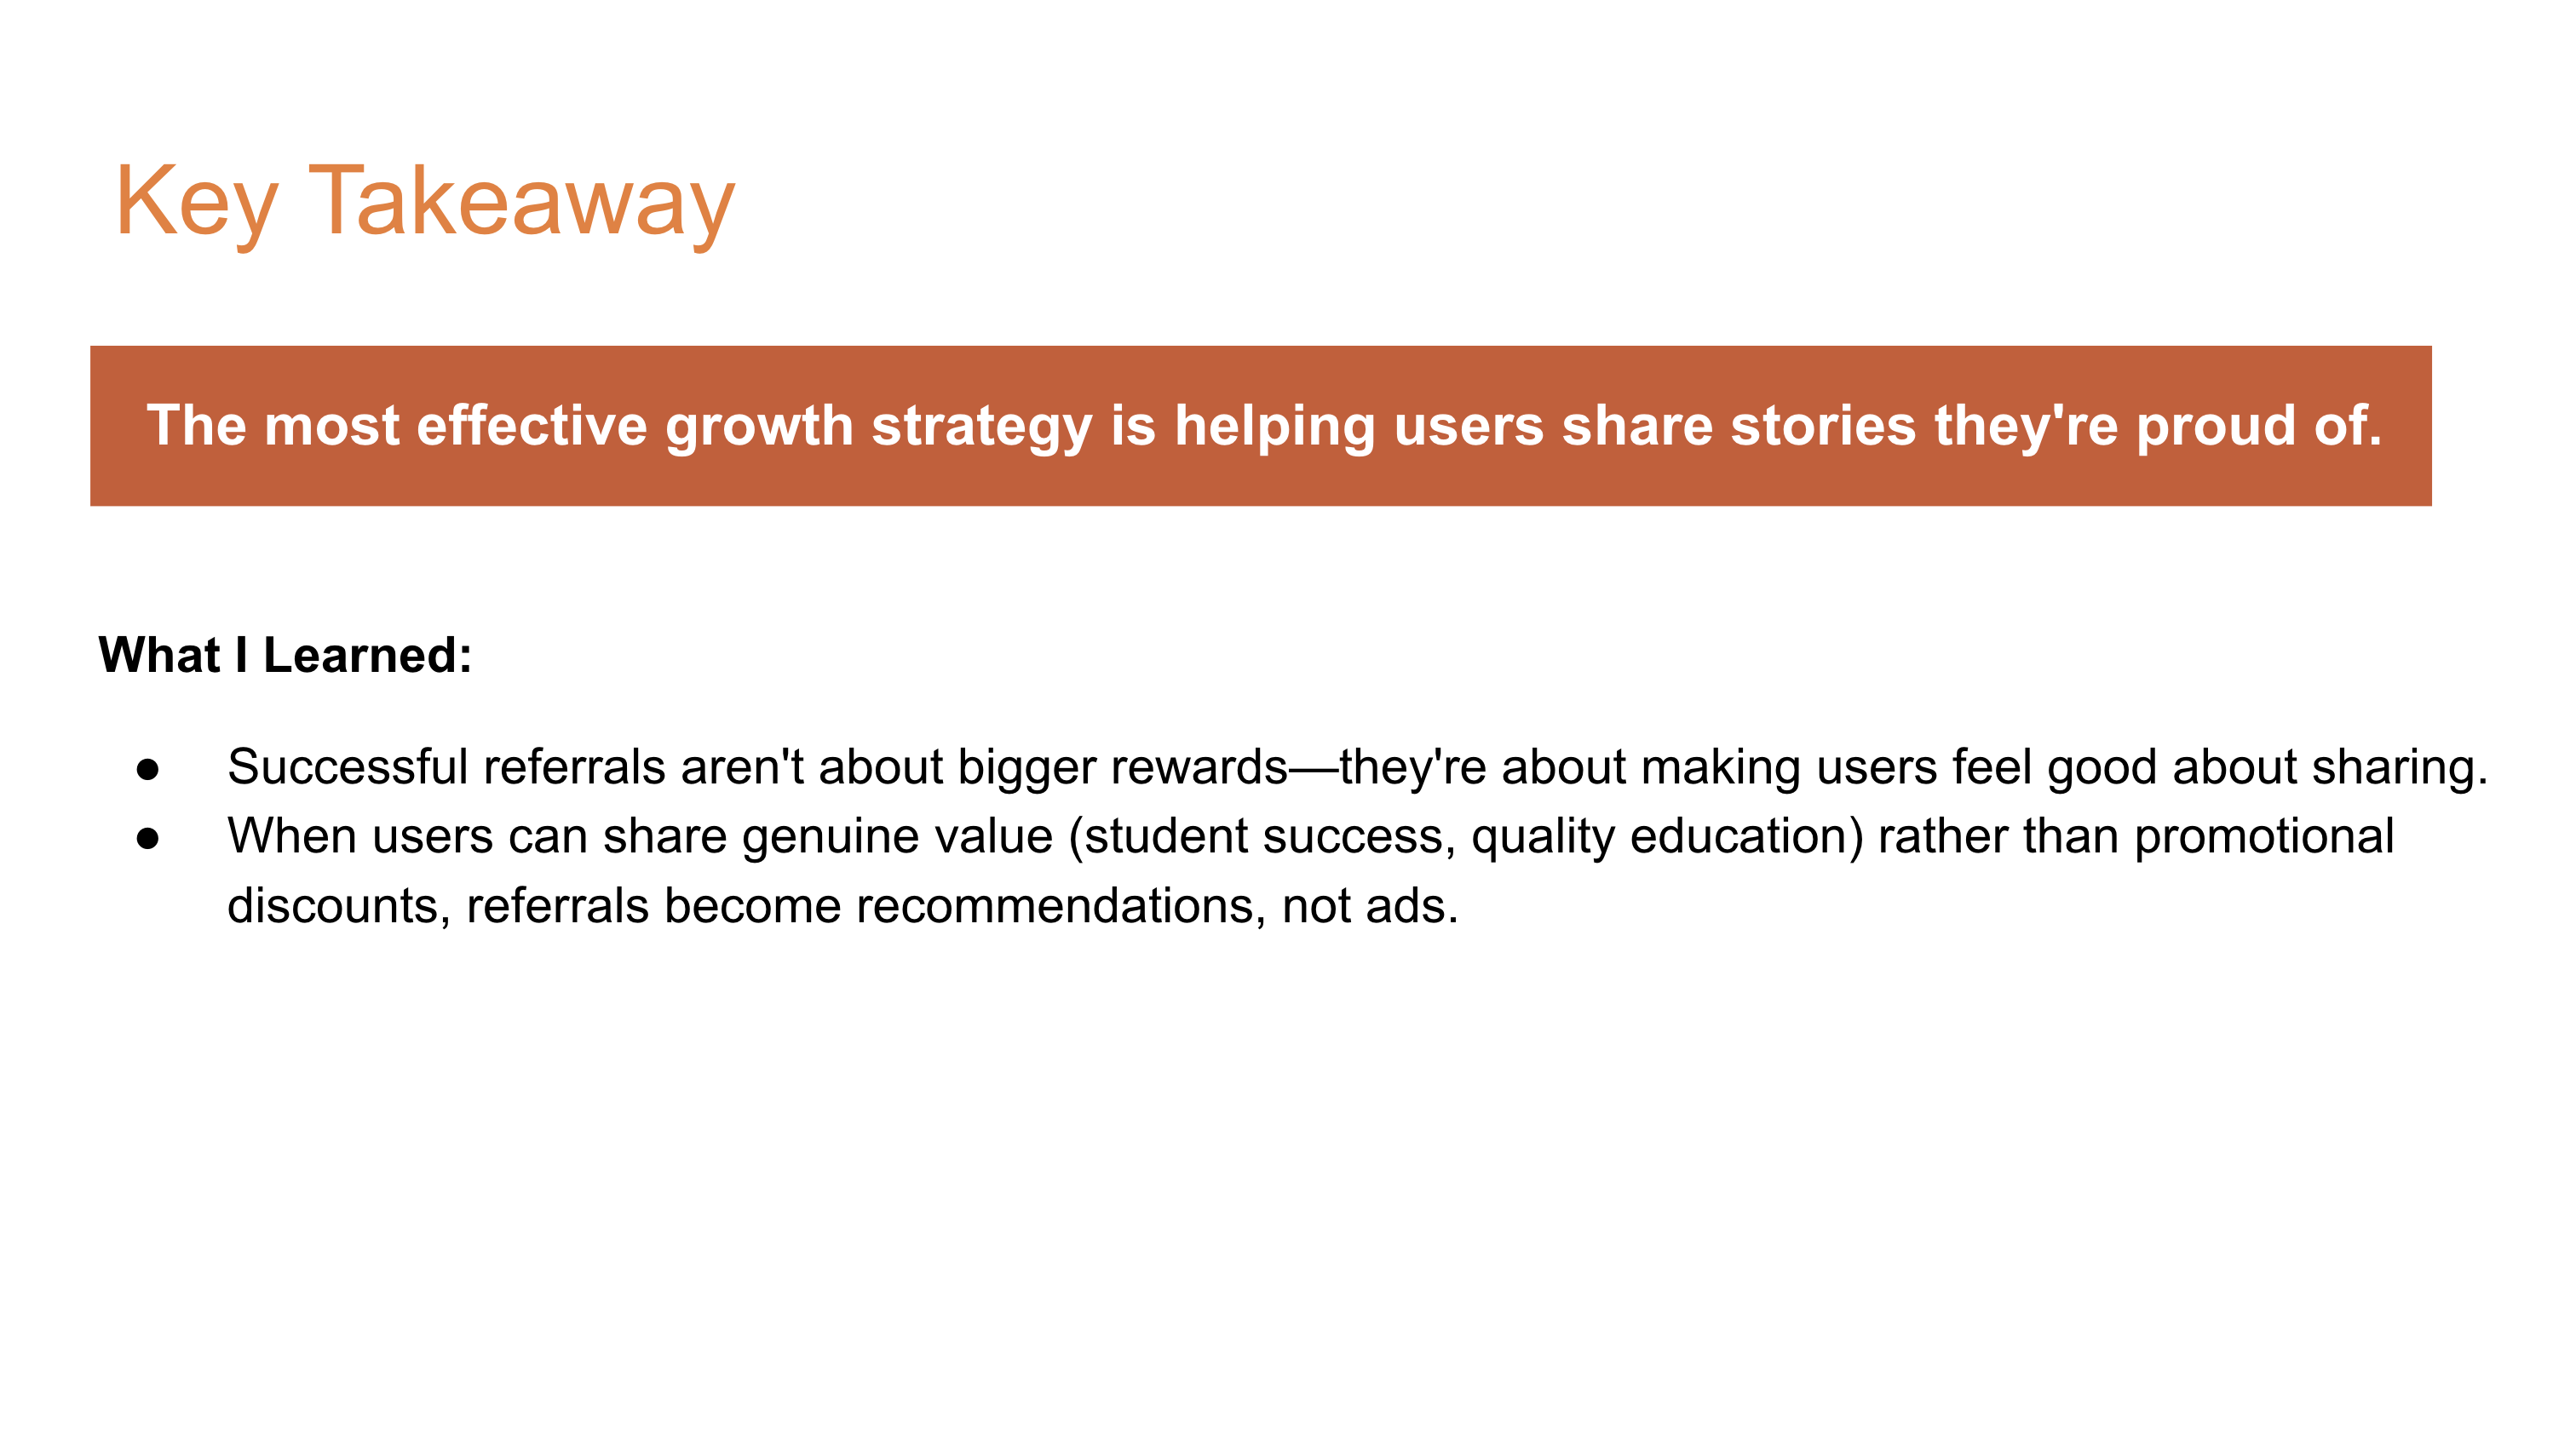
Reflection
Appendix
This section contains comprehensive data analysis, research methodology details, and supporting evidence for the insights presented in the main case study.
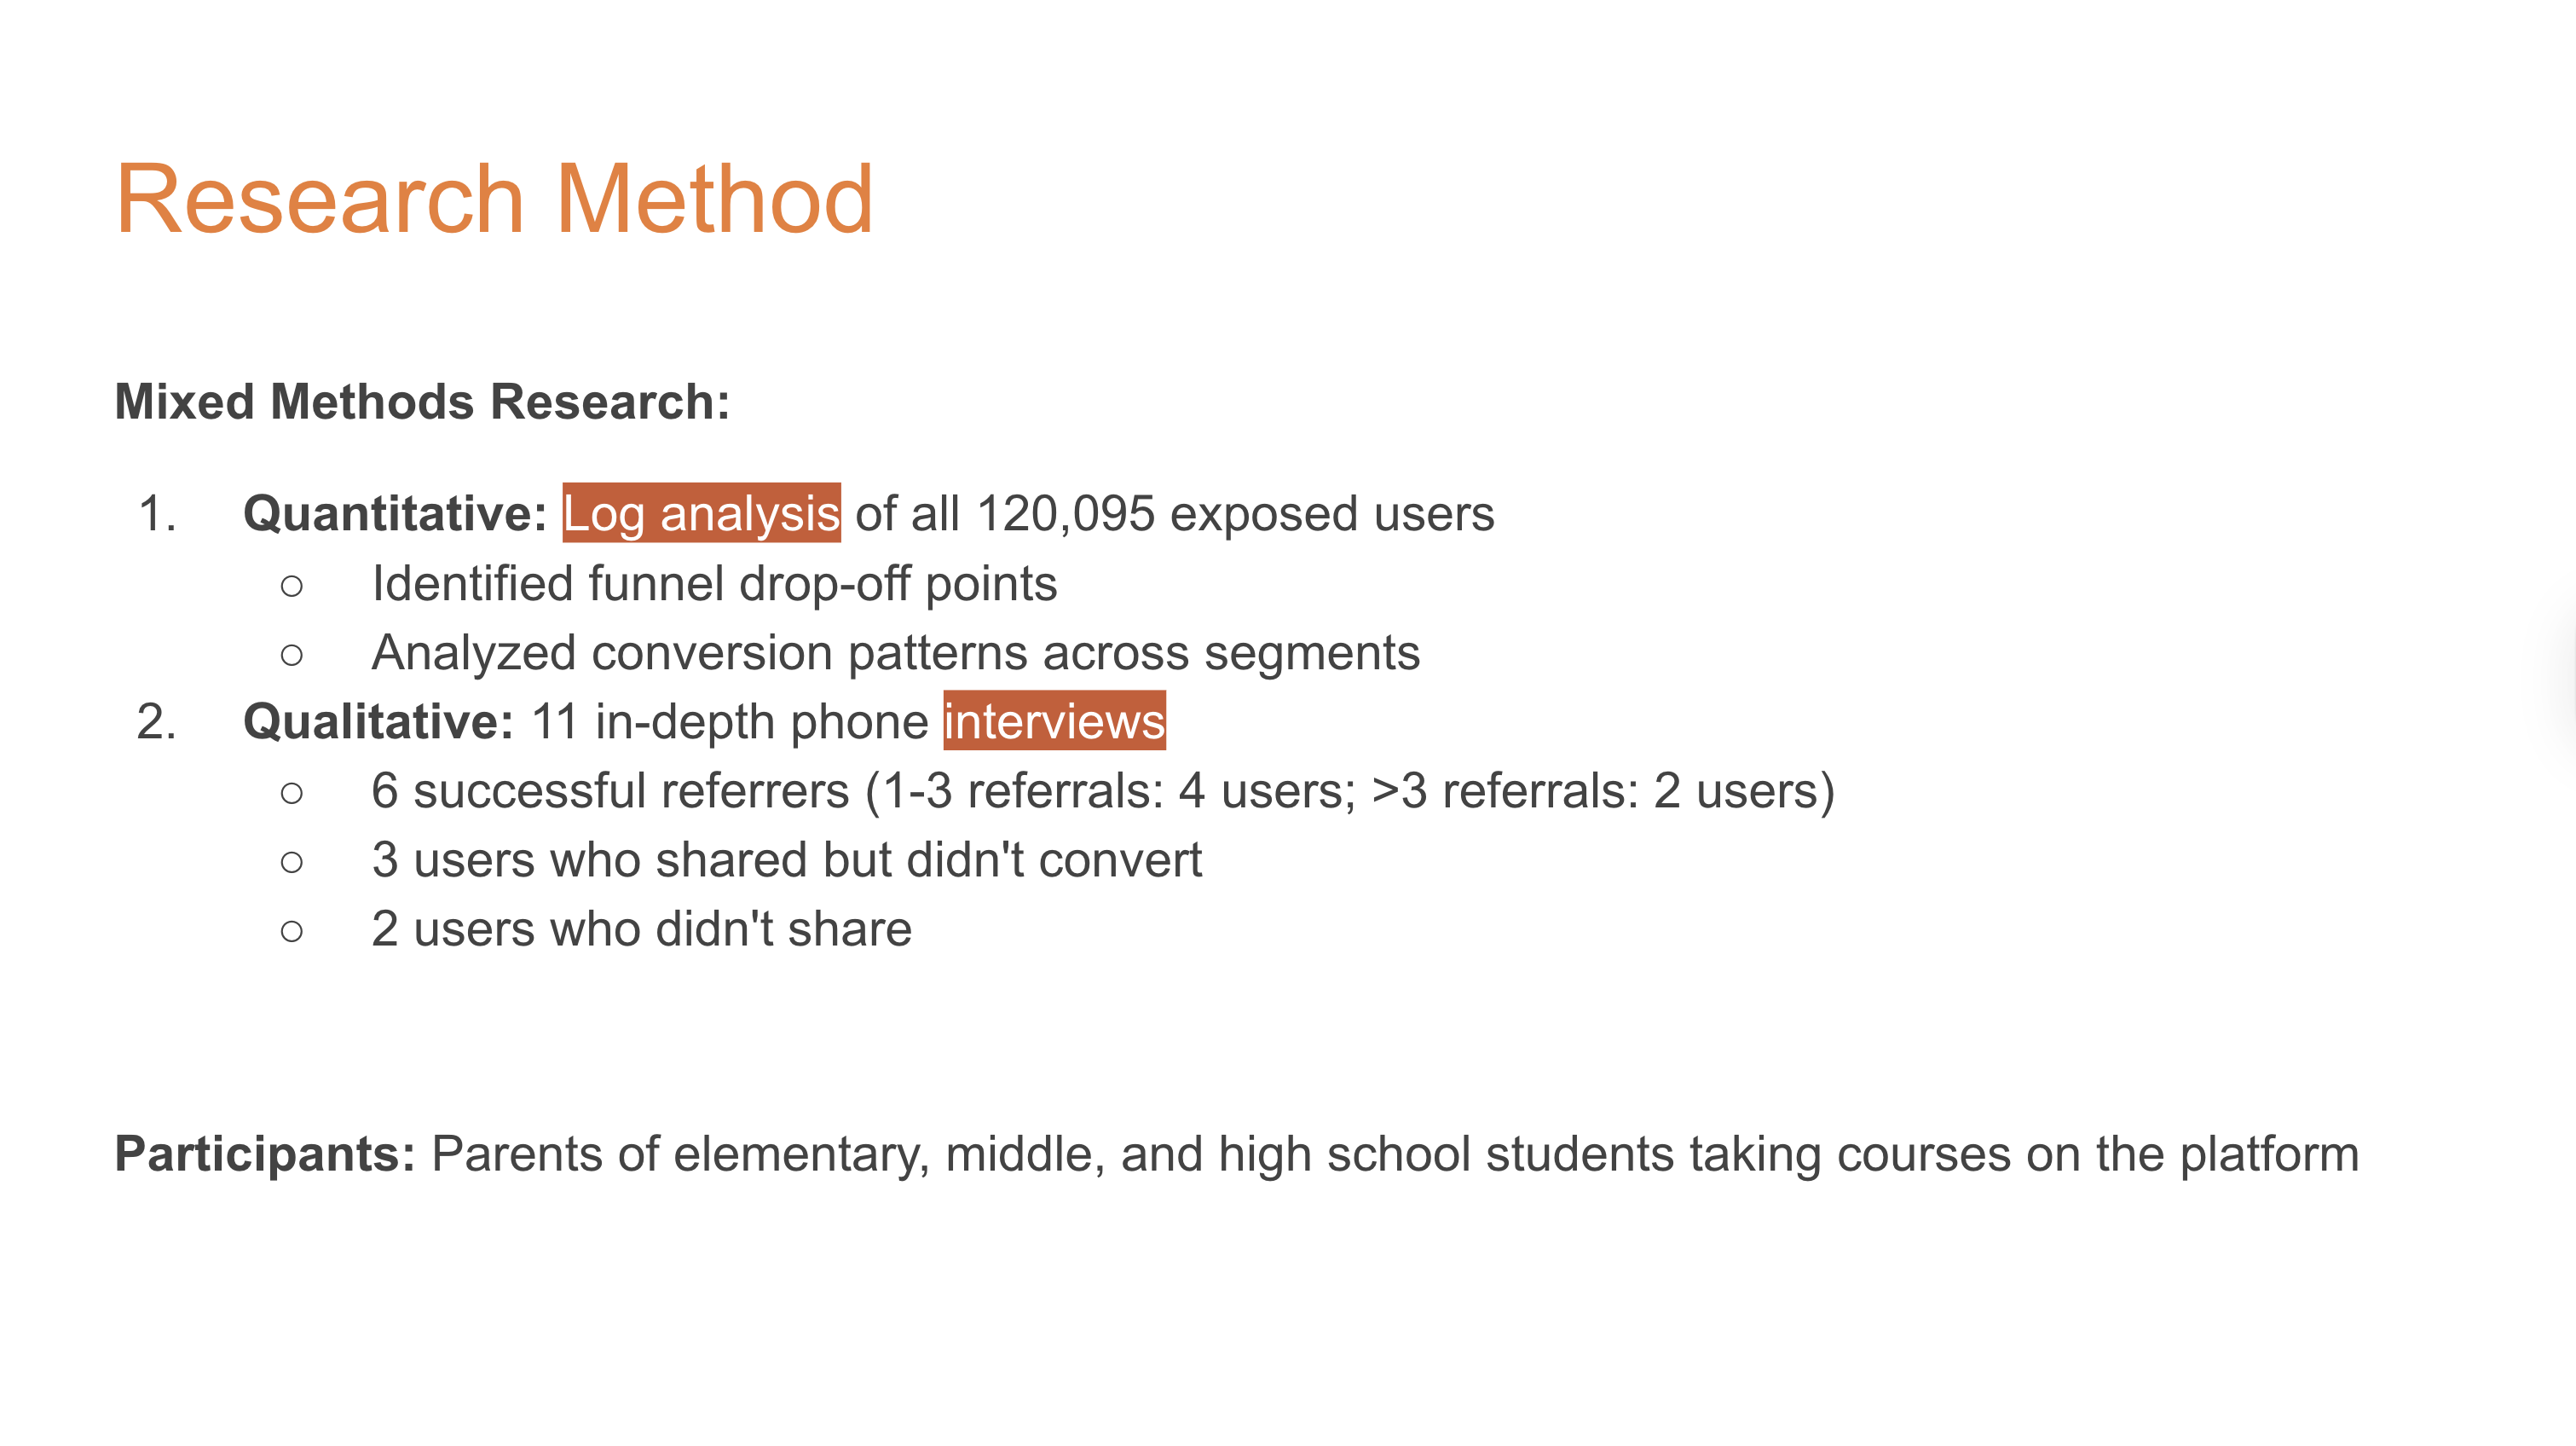
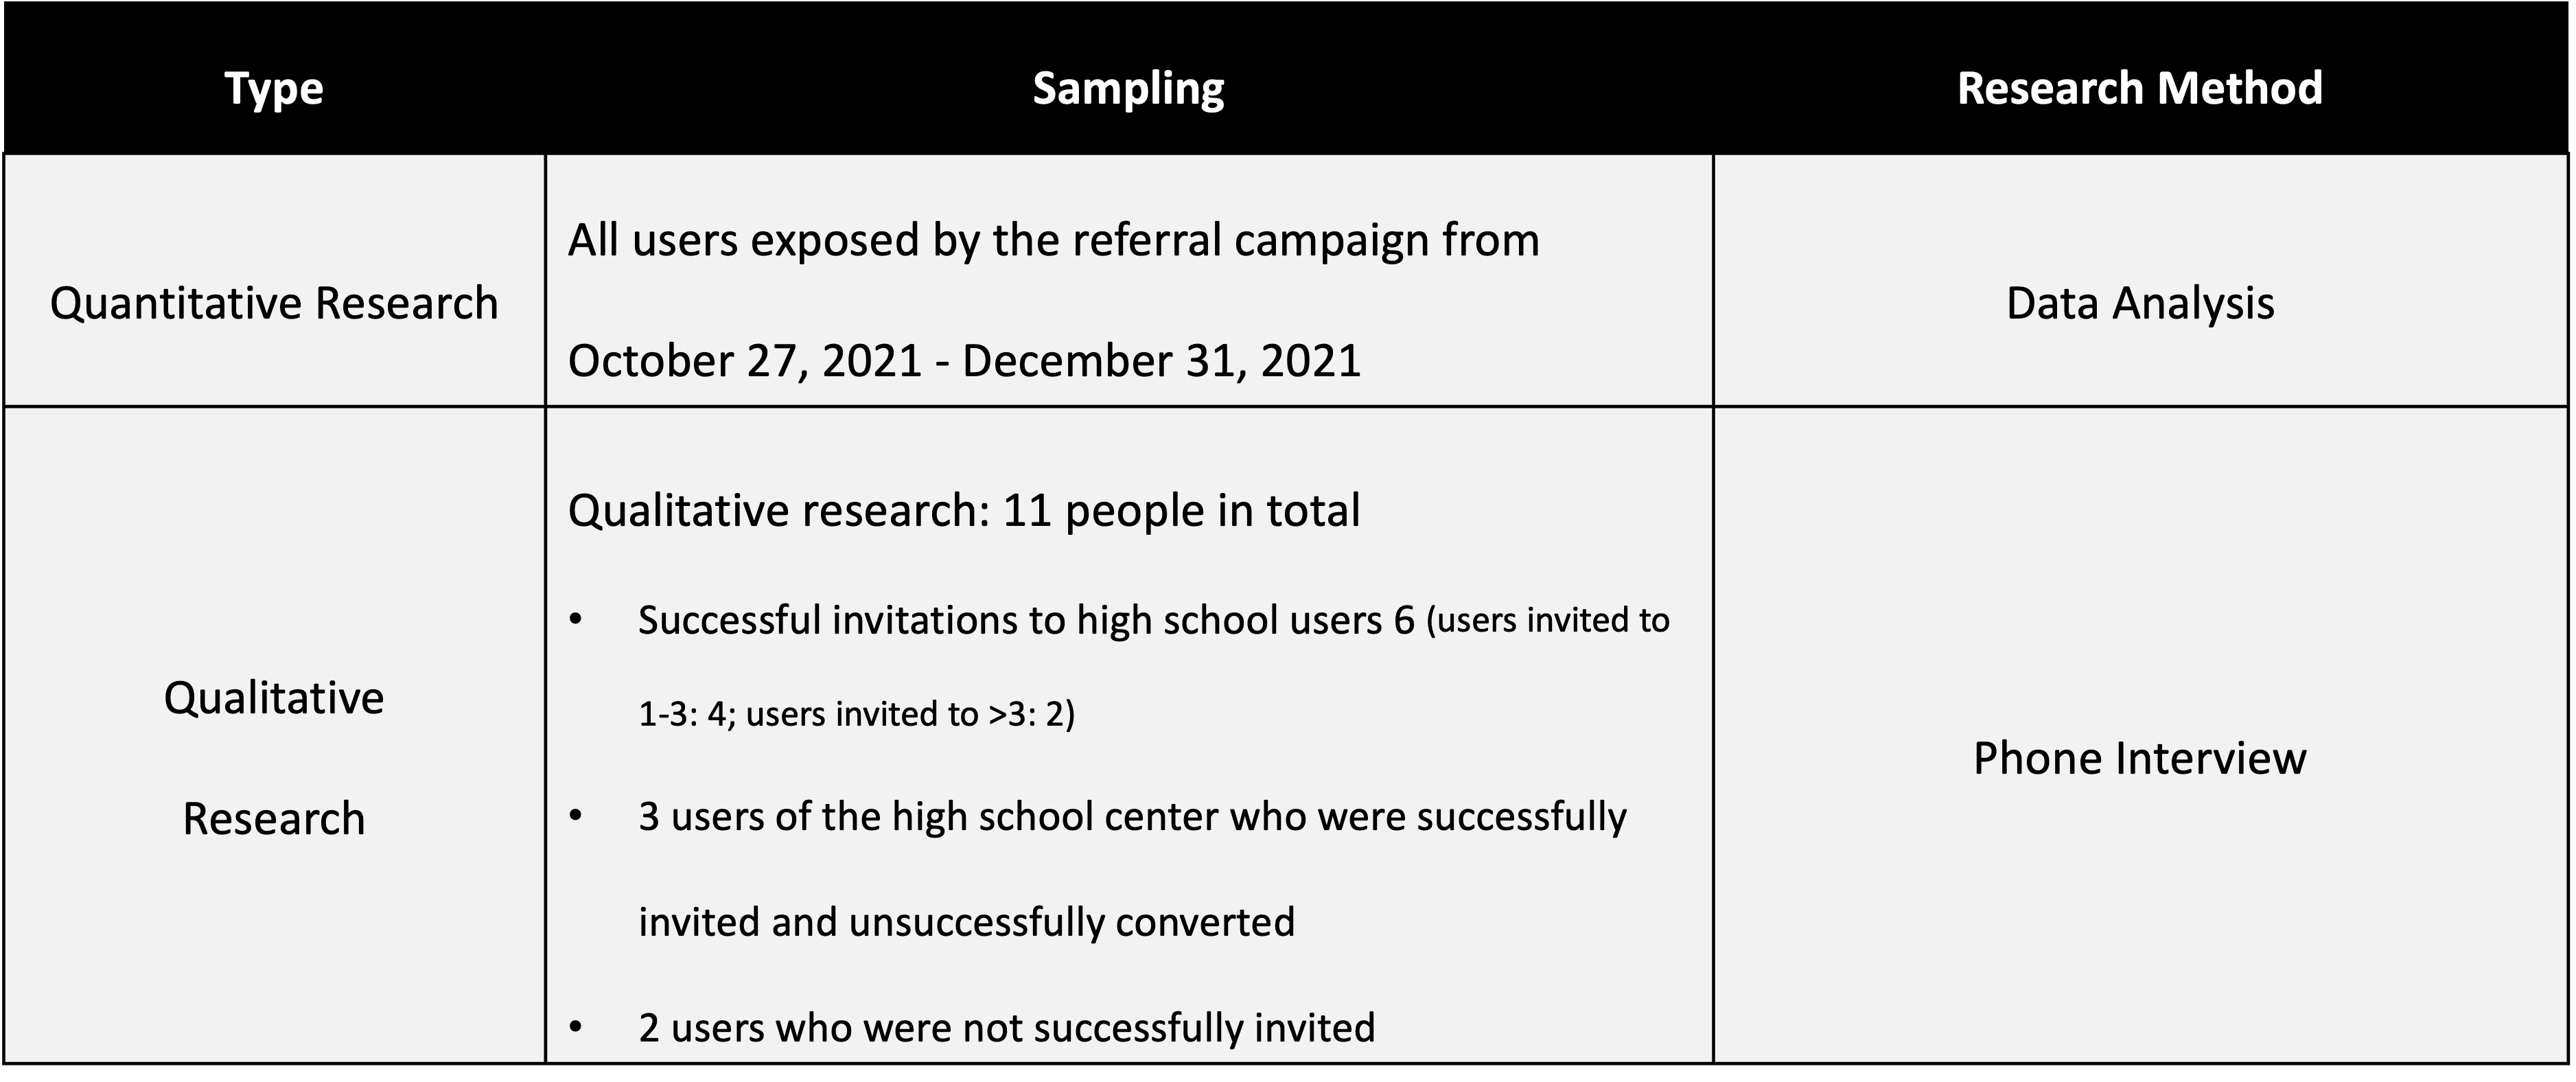
Research Methods
Research Groups: Elementary, junior and high school camp/experience class/regular price class users, mainly parents
Conversion Data
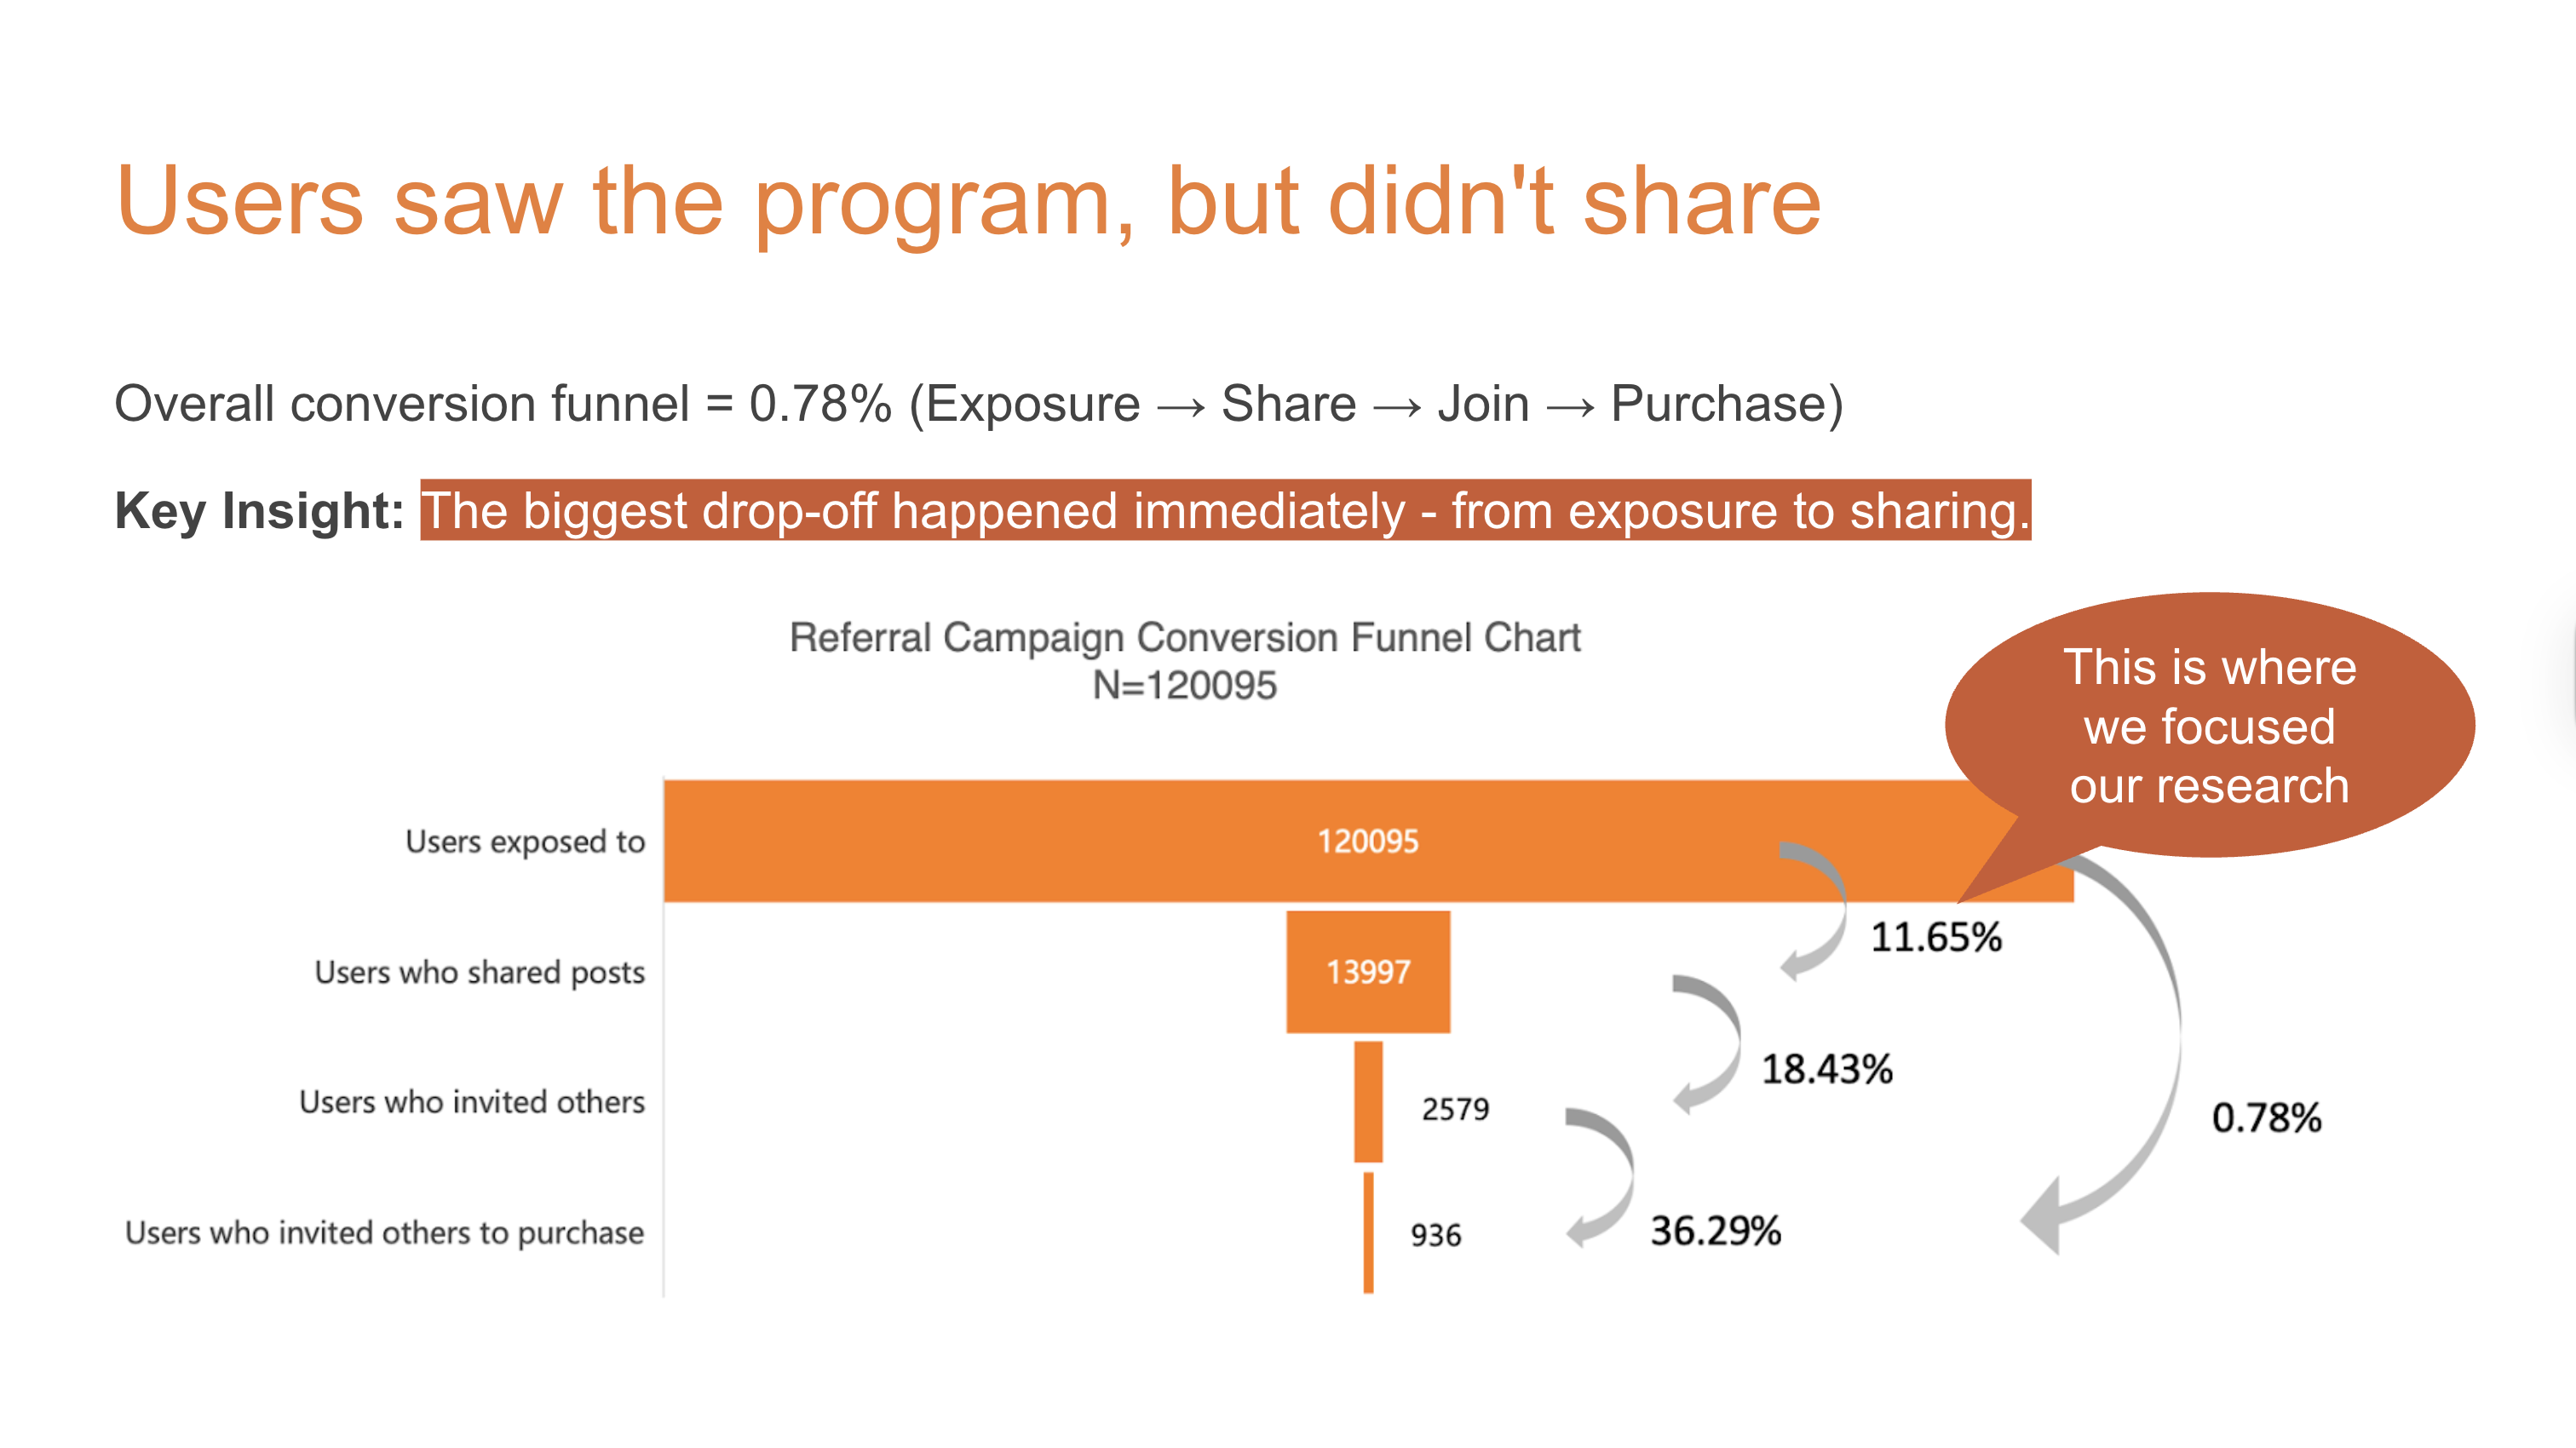
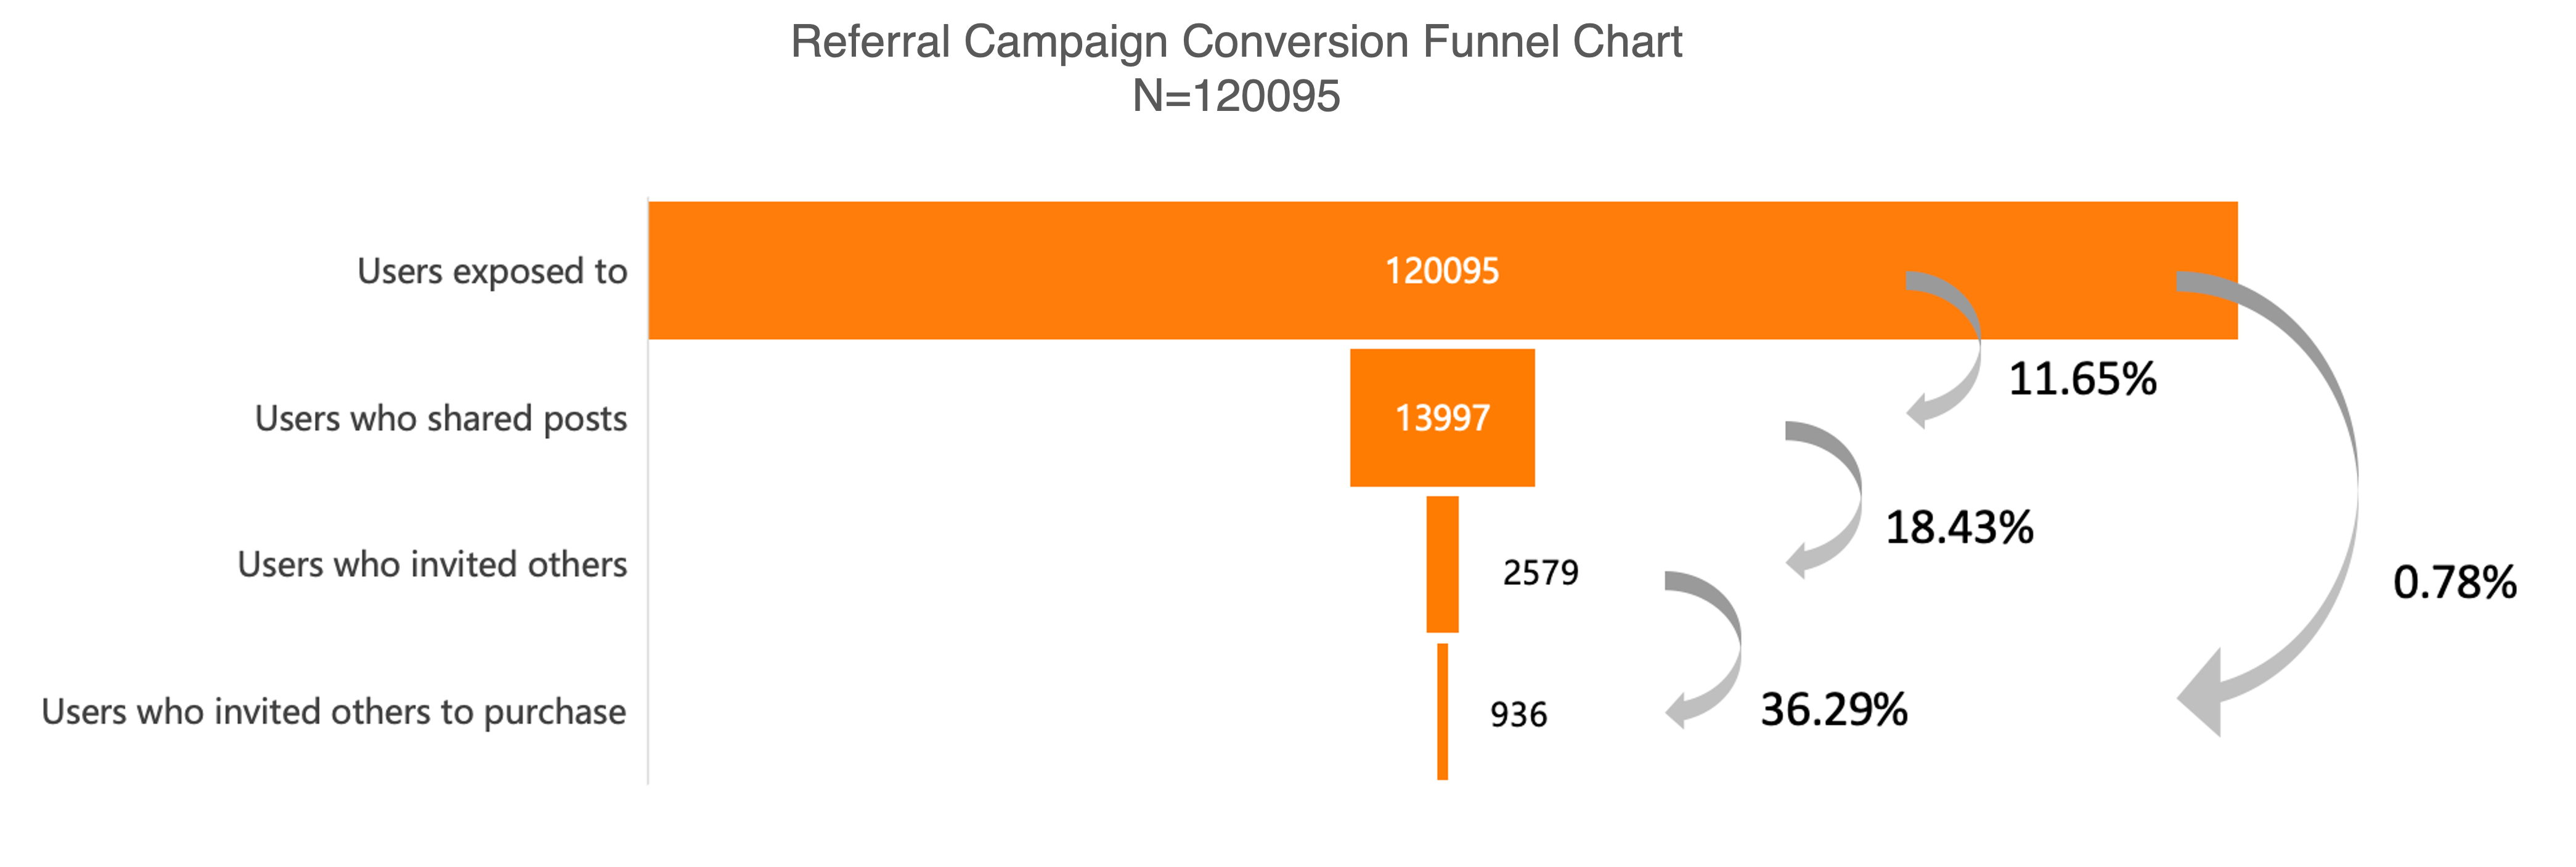
Overall Conversion Rate
The overall conversion rate is 0.78%, the proportion of users from exposure to sharing is too low, which leads to a low overall conversion rate. Therefore, the subsequent improvement process can focus on the process of sharing from exposure to enhance the user sharing rate.
Conversion Rate by Division (Elementary, Middle, and High School)
- Elementary school: highest exposure, highest sharing success rate, lowest invitation success rate; need to explore the motivation for sharing, analyze the reasons for the low invitation success rate
- Middle School: lowest exposure, lowest sharing success rate, lowest conversion success rate; need to focus on improving exposure and sharing rate
- High school: low sharing success rate, highest invitation success rate, highest conversion success rate, highest overall conversion rate; need to focus on improving the sharing rate

Conversion Successful User Profile
From the perspective of the school section, the high school section has the highest percentage of successful users, reaching 89.31%.

New Users vs. Old Users
898 old users successfully invited to 1080 new users, per capita successfully invited 1.2 new users.
Among the 1080 new users, 988 new users were from the senior high school, accounting for 91.5%.
Number of new users in the senior high school: first year senior high school > third year senior high school > second year senior high school.

From the results of the data analysis, improving the sharing rate is very important to improve the overall conversion rate, and the proportion of new users in high school is the largest, so we will focus on the sharing behavior of users in high school in the qualitative analysis.
Interview Findings
Through telephone interviews with 11 participants, I learned about the understanding of the high school users of the referral program, their motivations for participating in the program, as well as sorting out their suggestions for the program.
Interview Findings
- Users generally had some impression of the “Invite for Gift” campaign
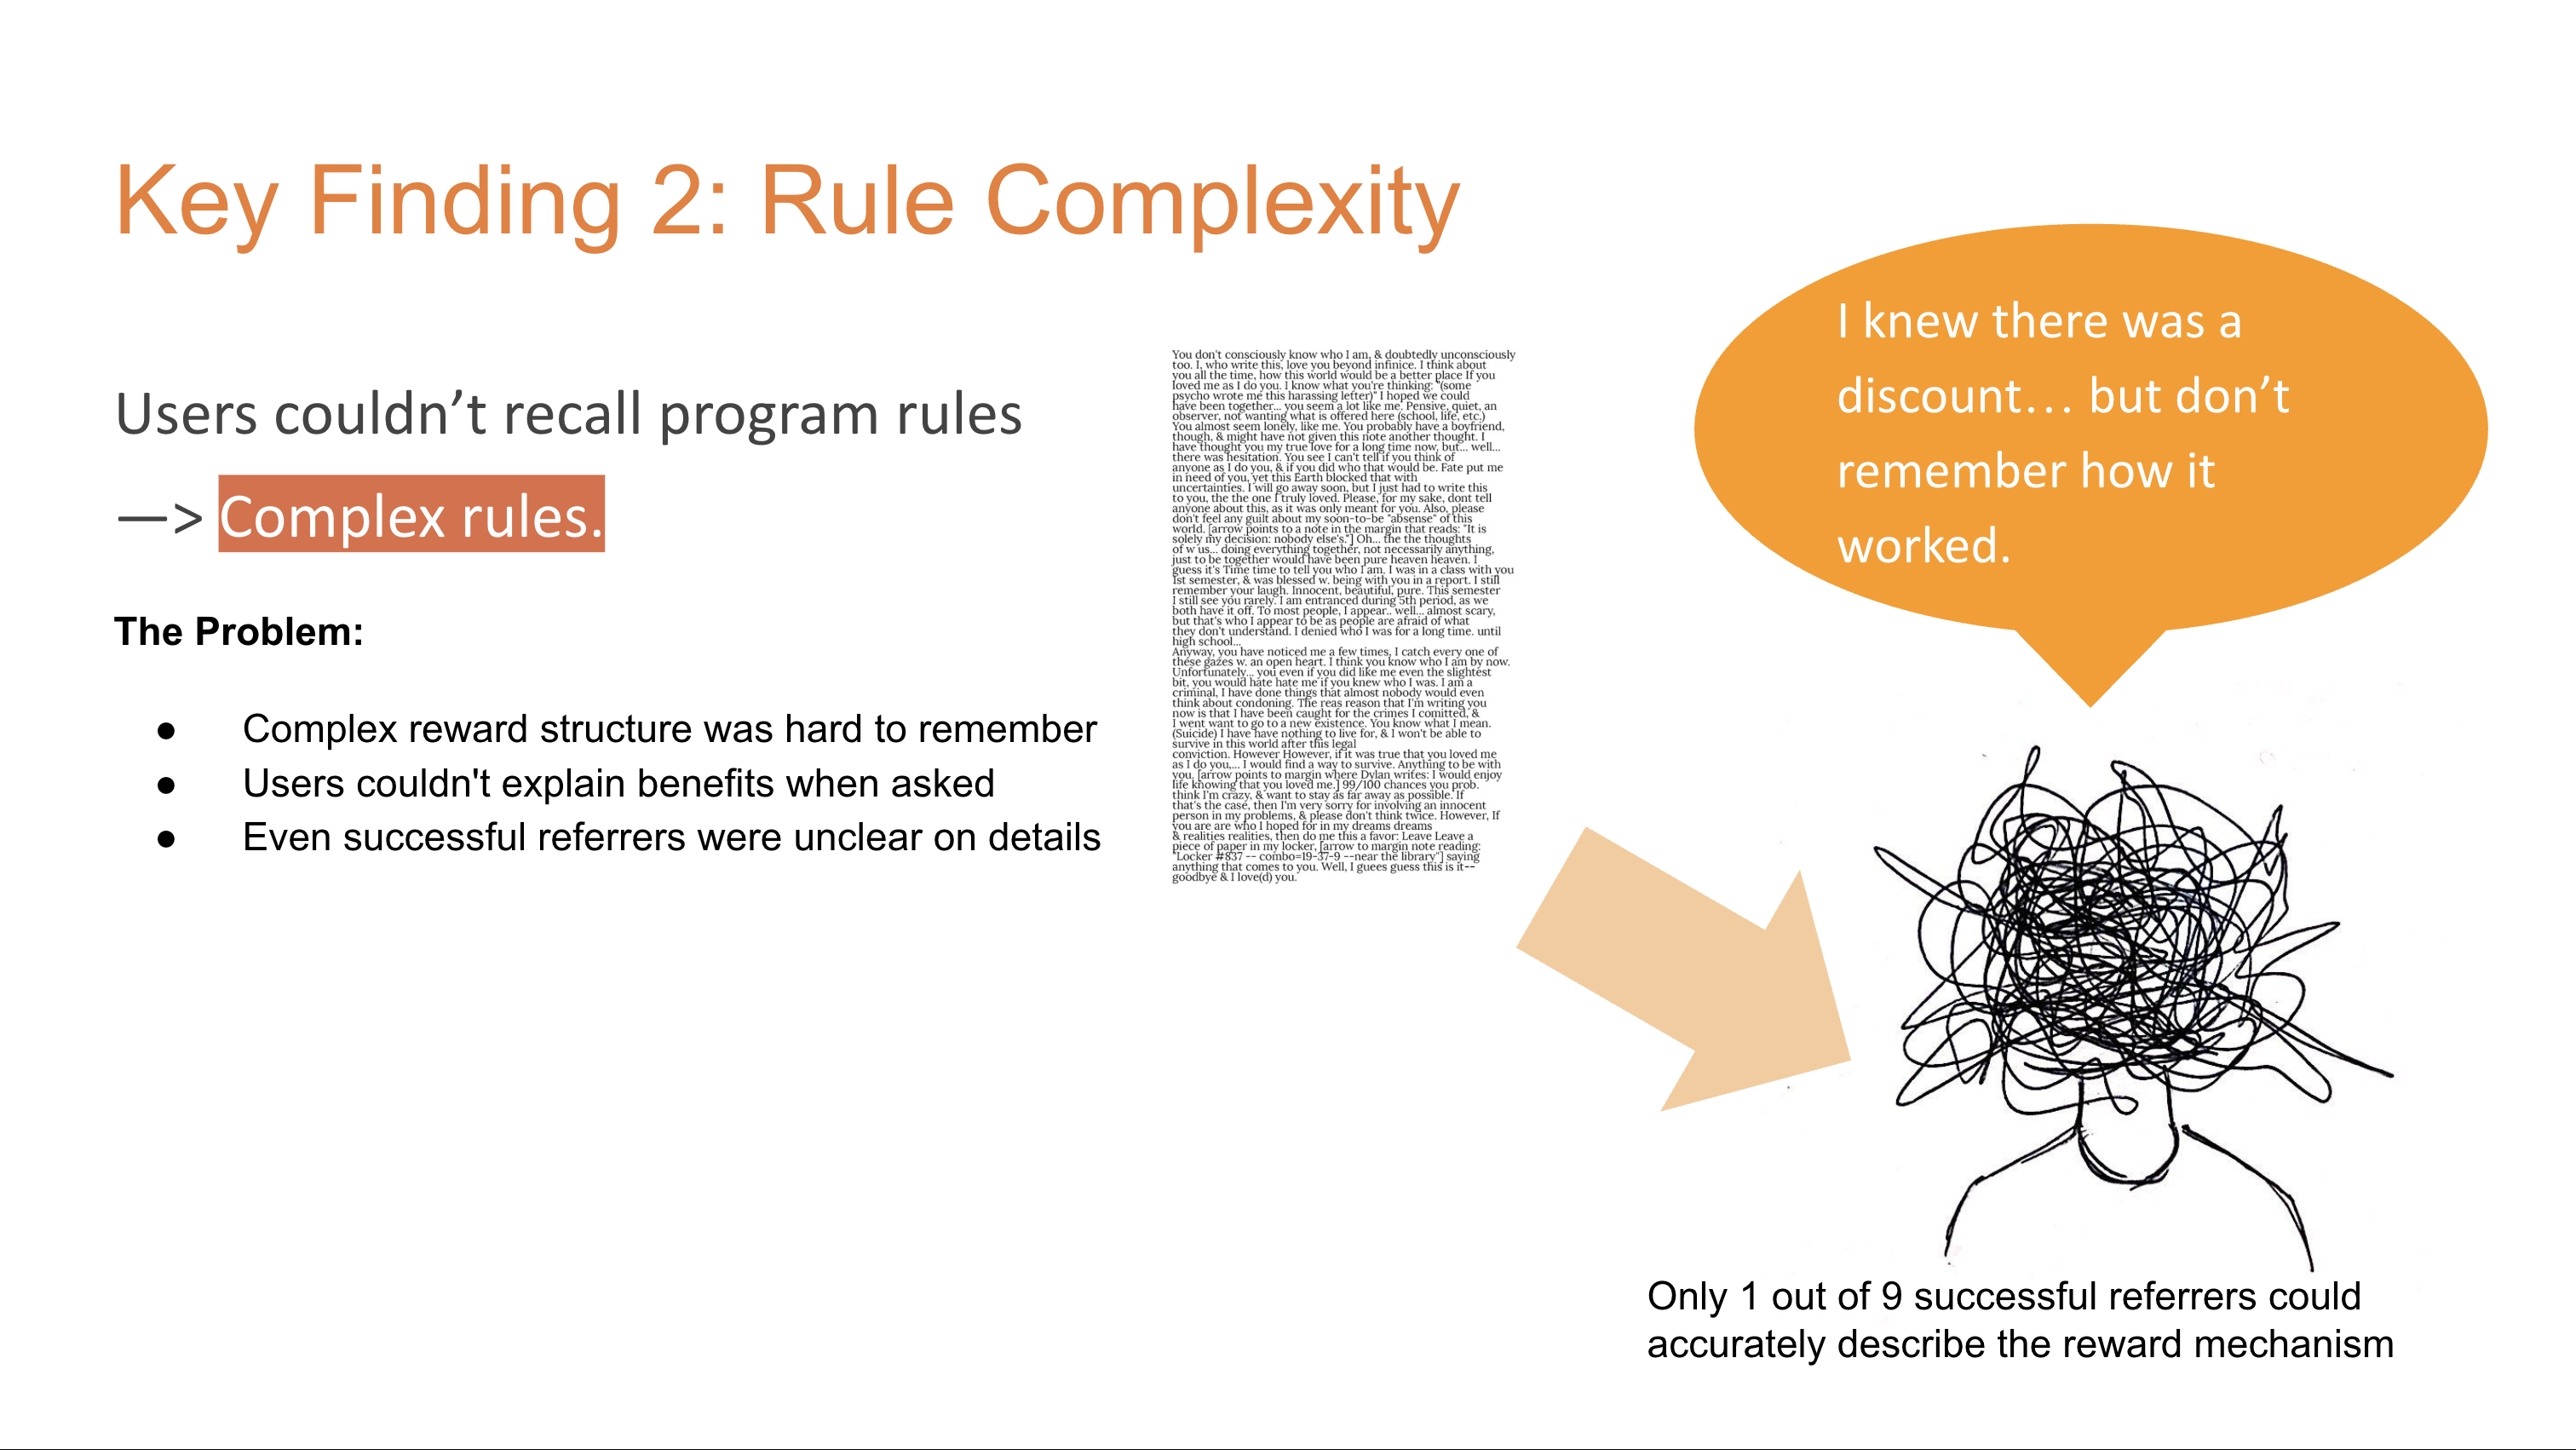
- Most users cannot recall the specific program rules
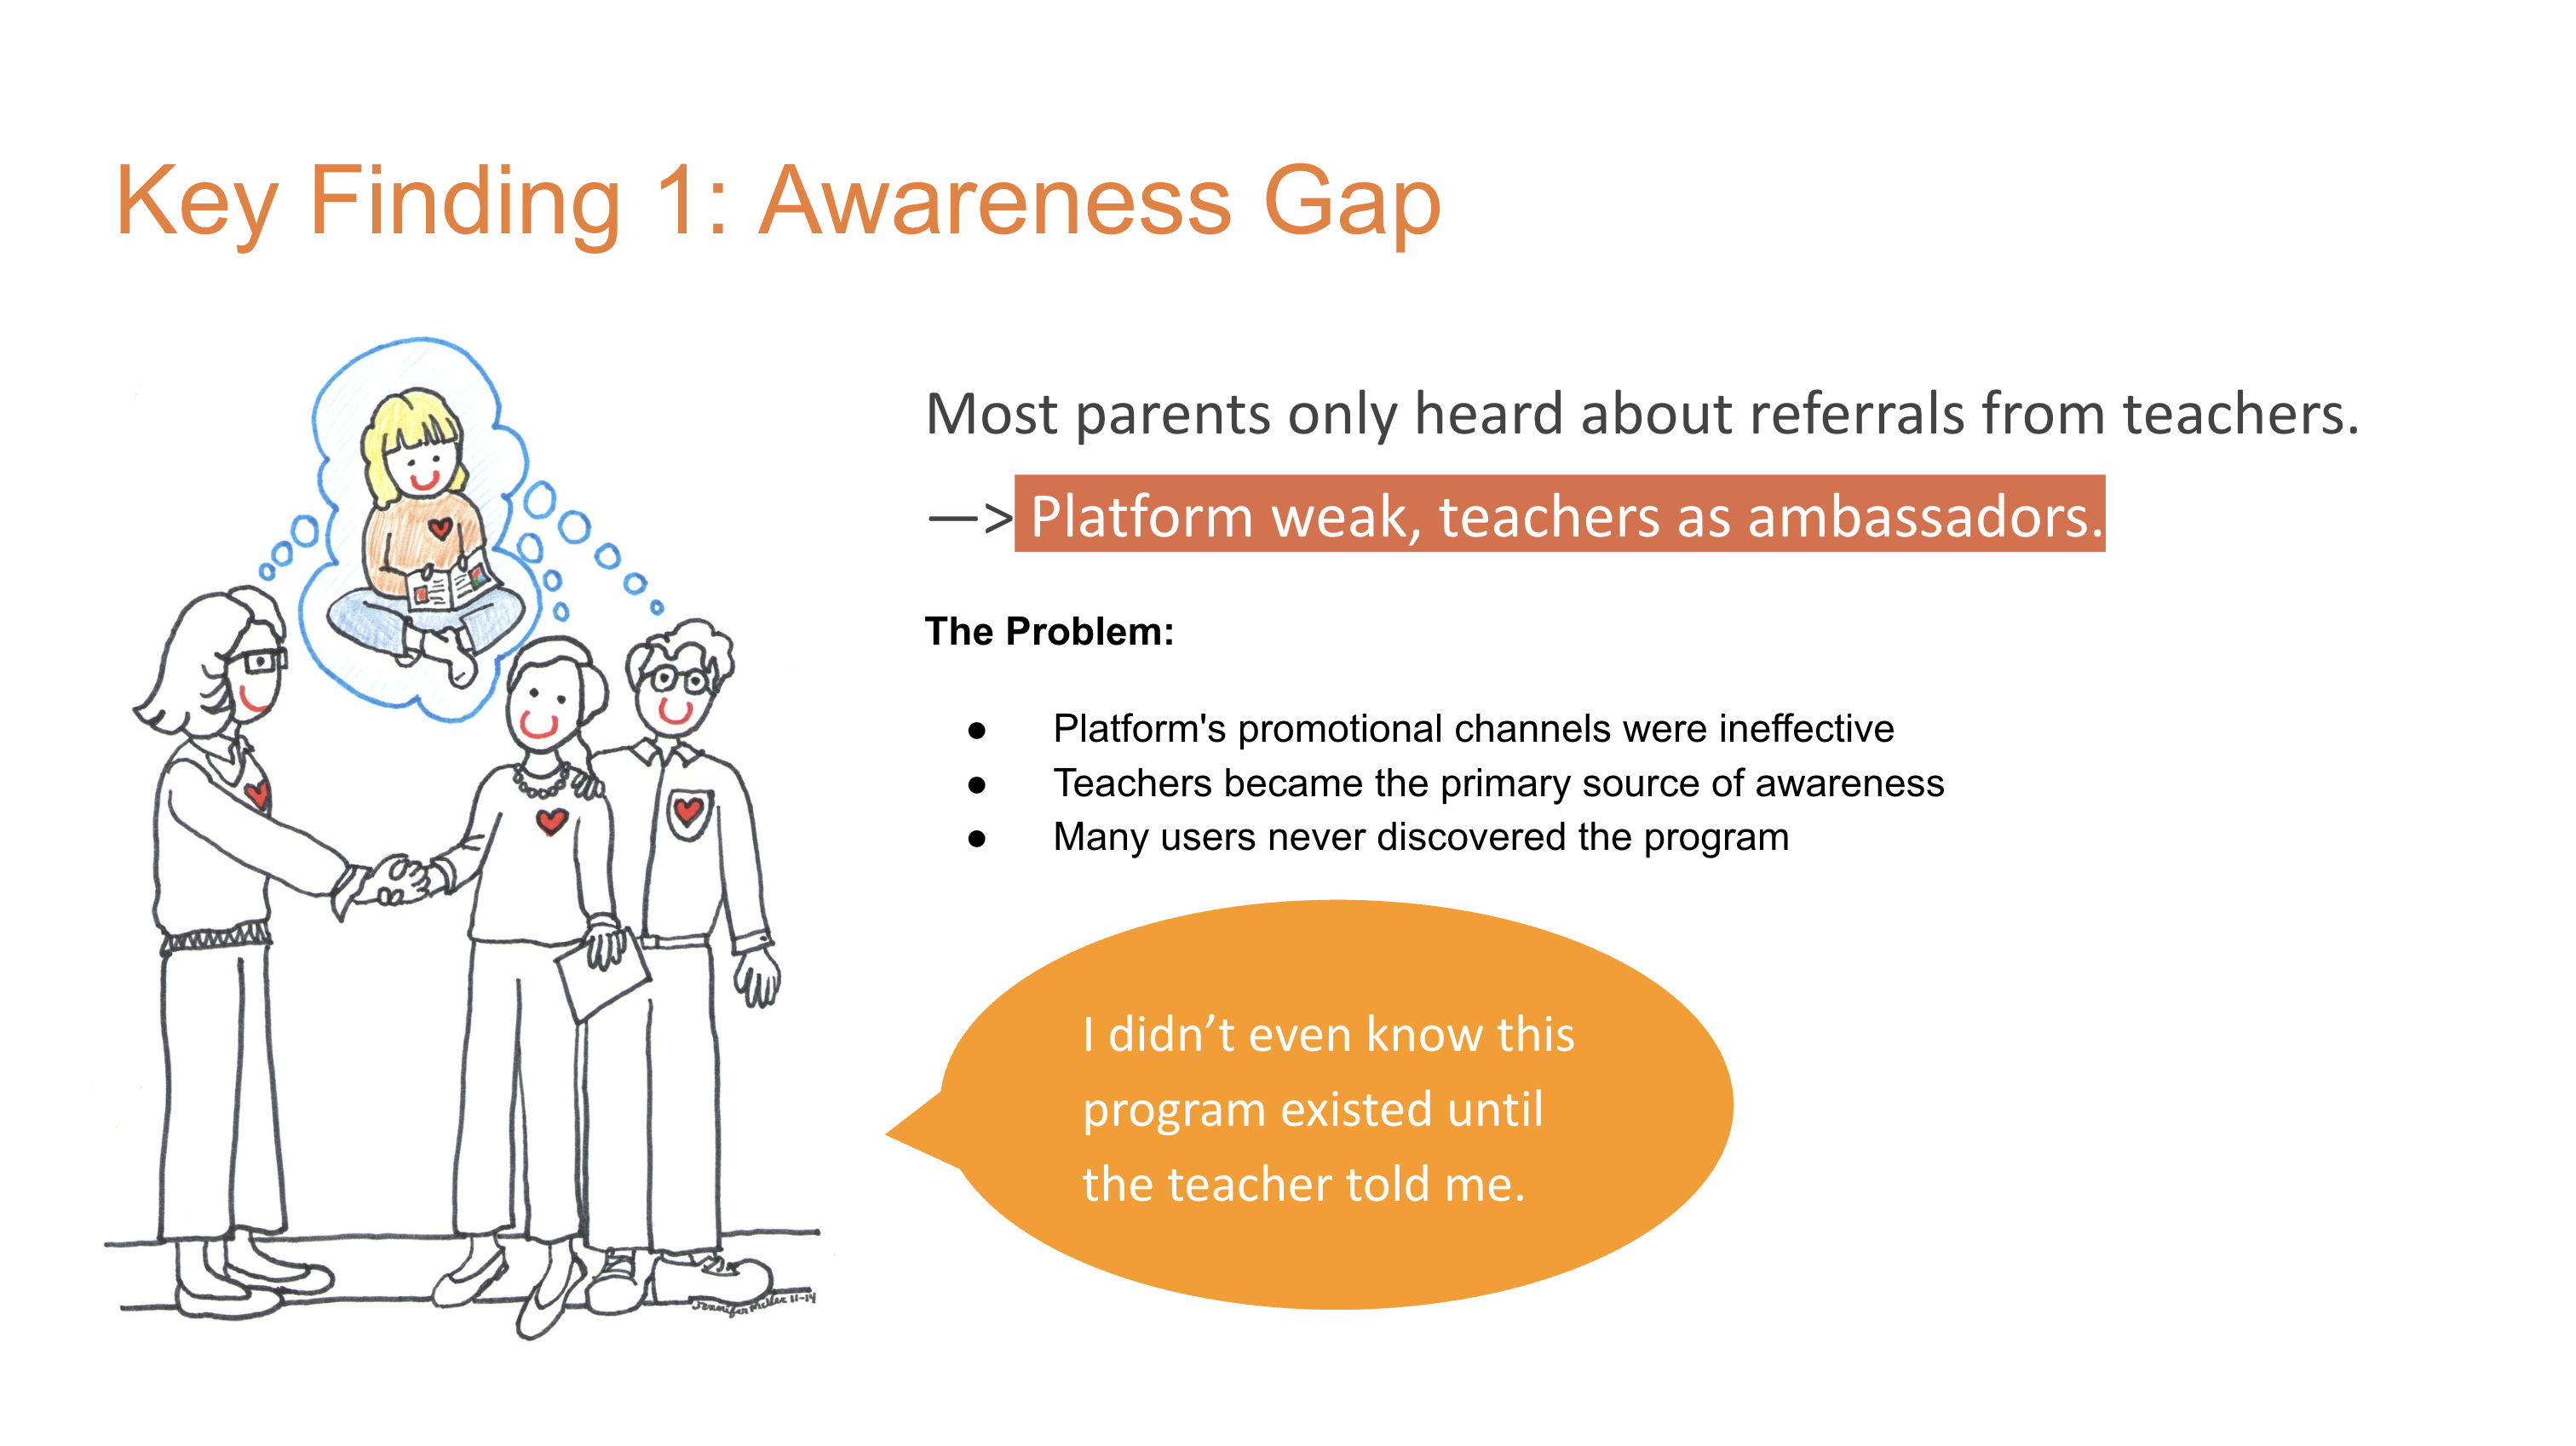
- Most users learned about the program from their teachers
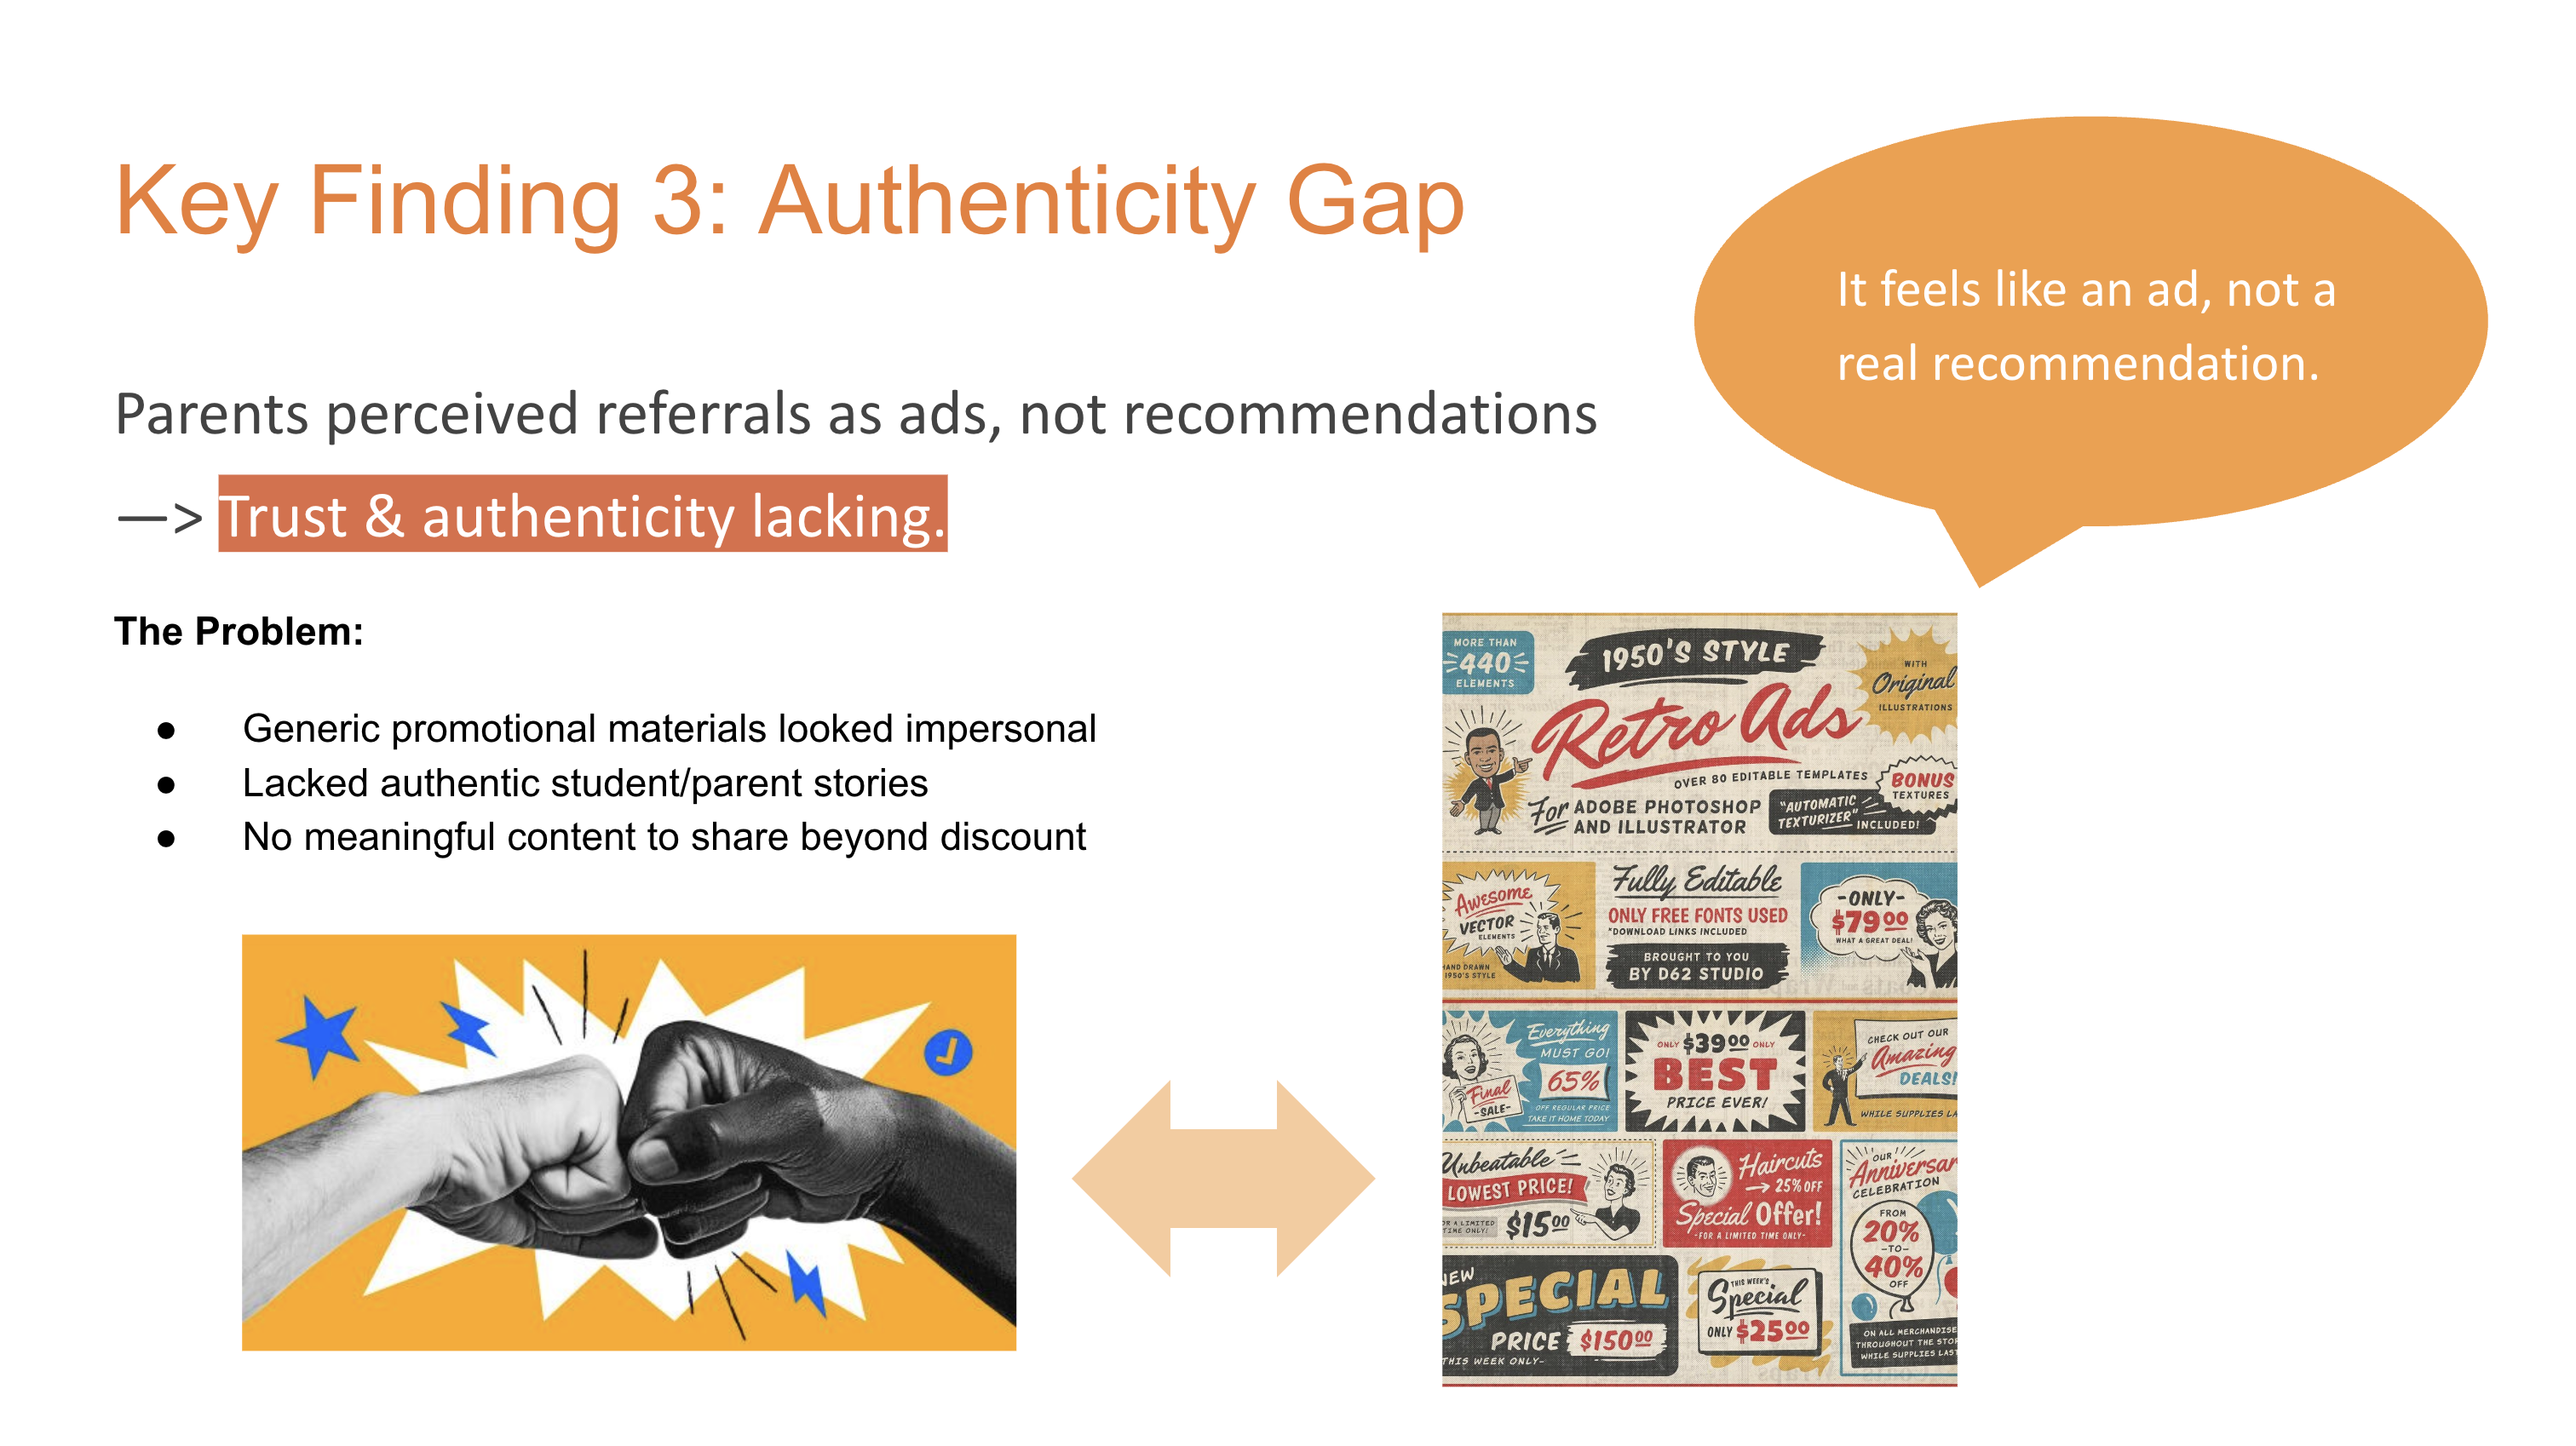
- Users seek a clearer, more straightforward referral program with less promotional and more authentic communication
What motivates participation/non-participation
Motivations for participation:
- The high quality of the course
- Significant benefits gained by the student
- Recognizing a need for the program in someone else’s life
Reasons for non-participation:
- Lack of awareness about the program
- Unclear timing details
- Inappropriate timing of the program’s promotion, such as right before a lesson, which users found unsuitable
The interviews revealed that users seek a clearer, more straightforward referral program with less promotional and more authentic communication. They often shared program details through personal interactions, emphasizing the need for a user-friendly approach. This feedback suggests the importance of focusing on the program’s real value and impact, rather than just rewards, to enhance user engagement and participation.
Strategic Recommendations
