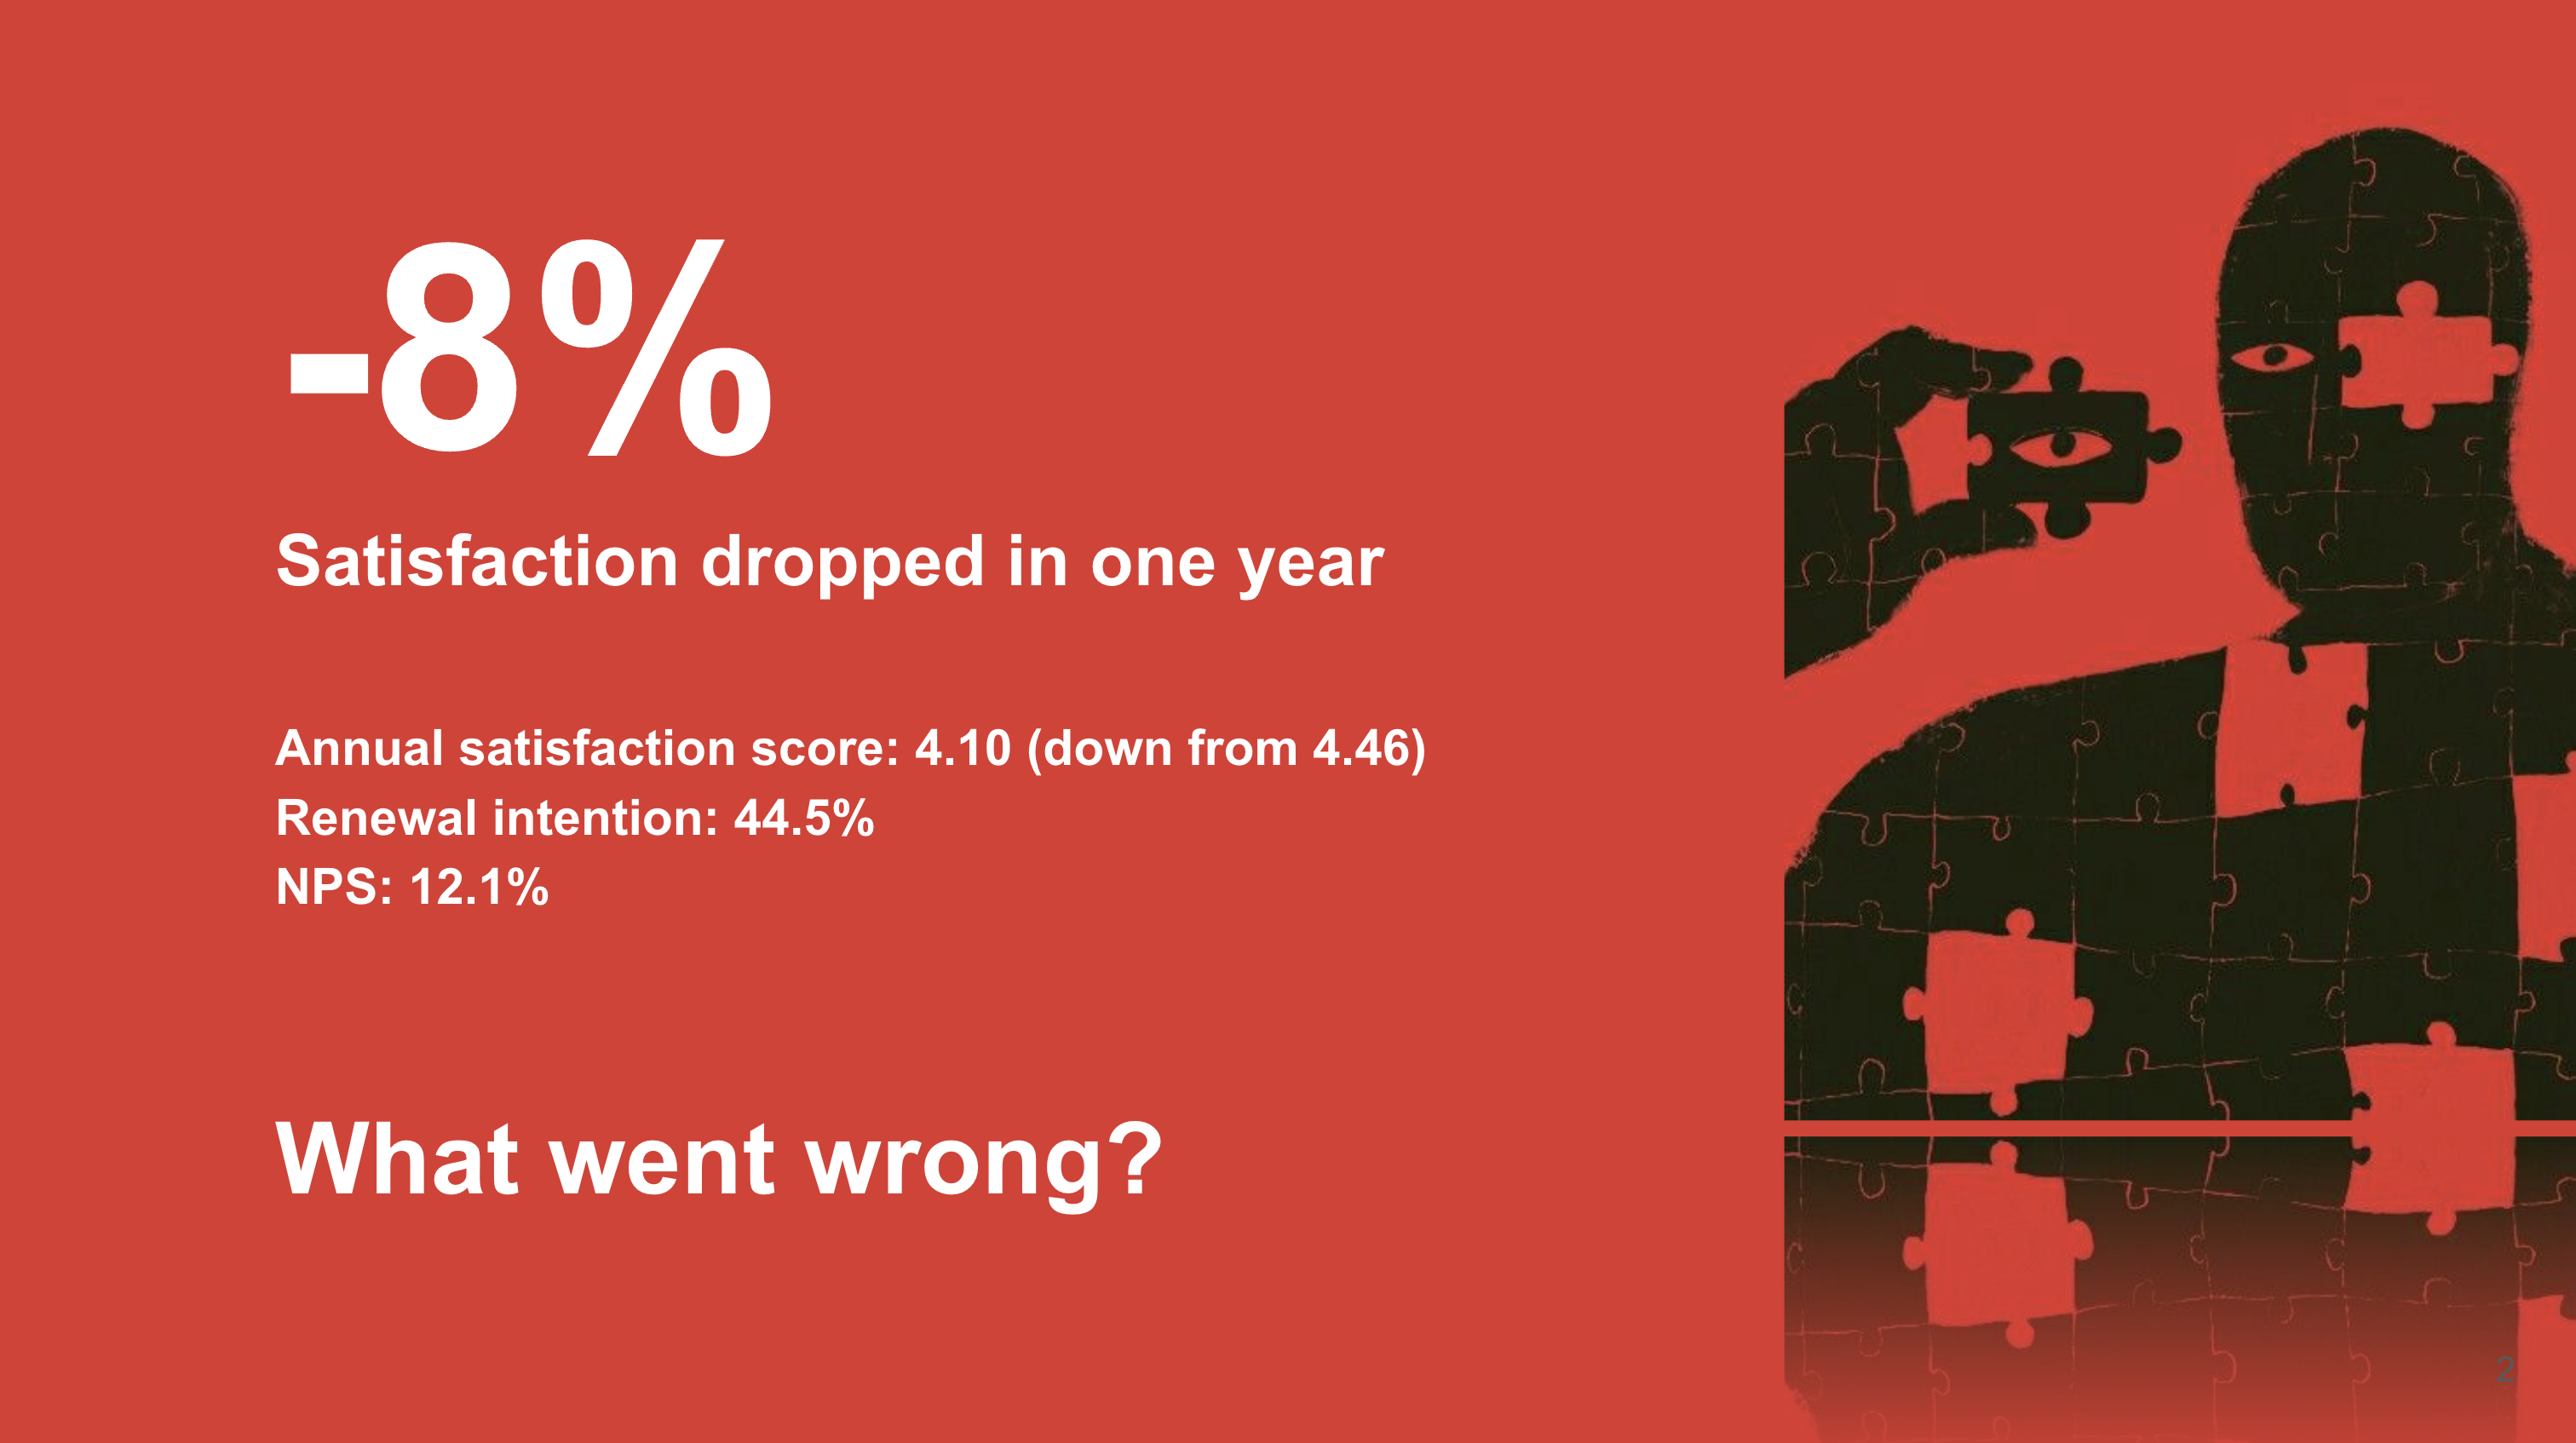
Problem
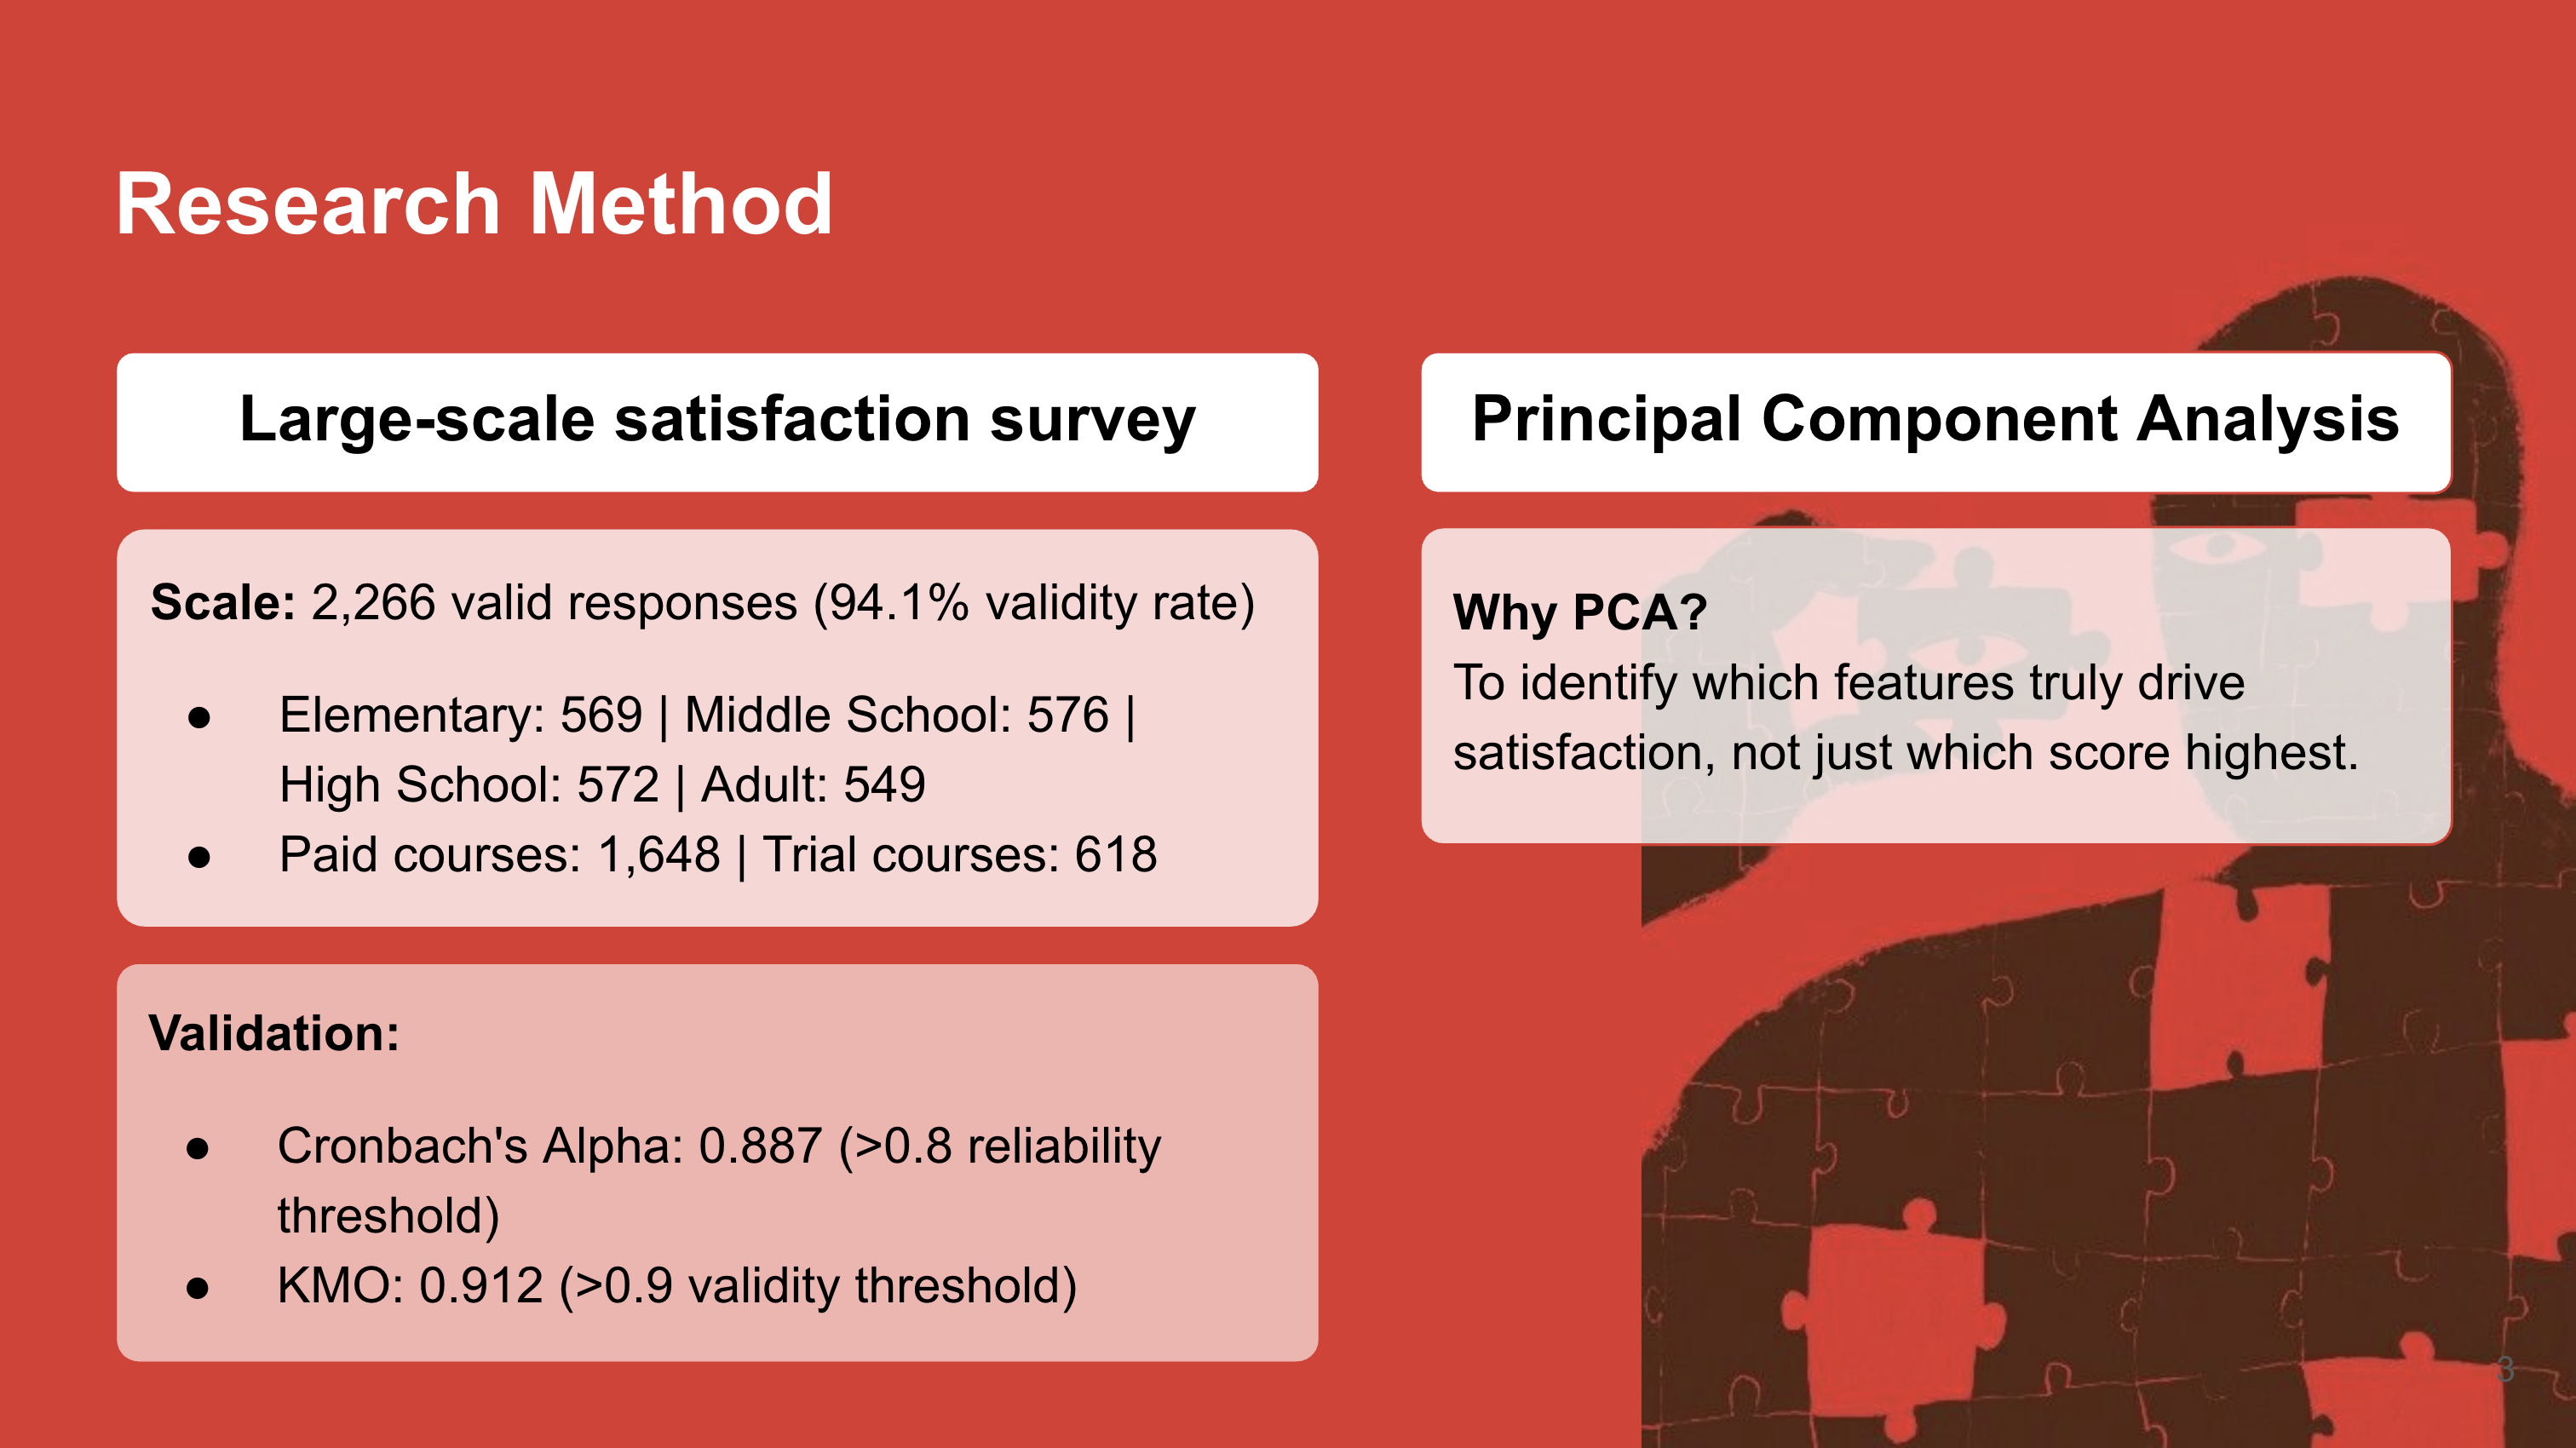
Research Approach
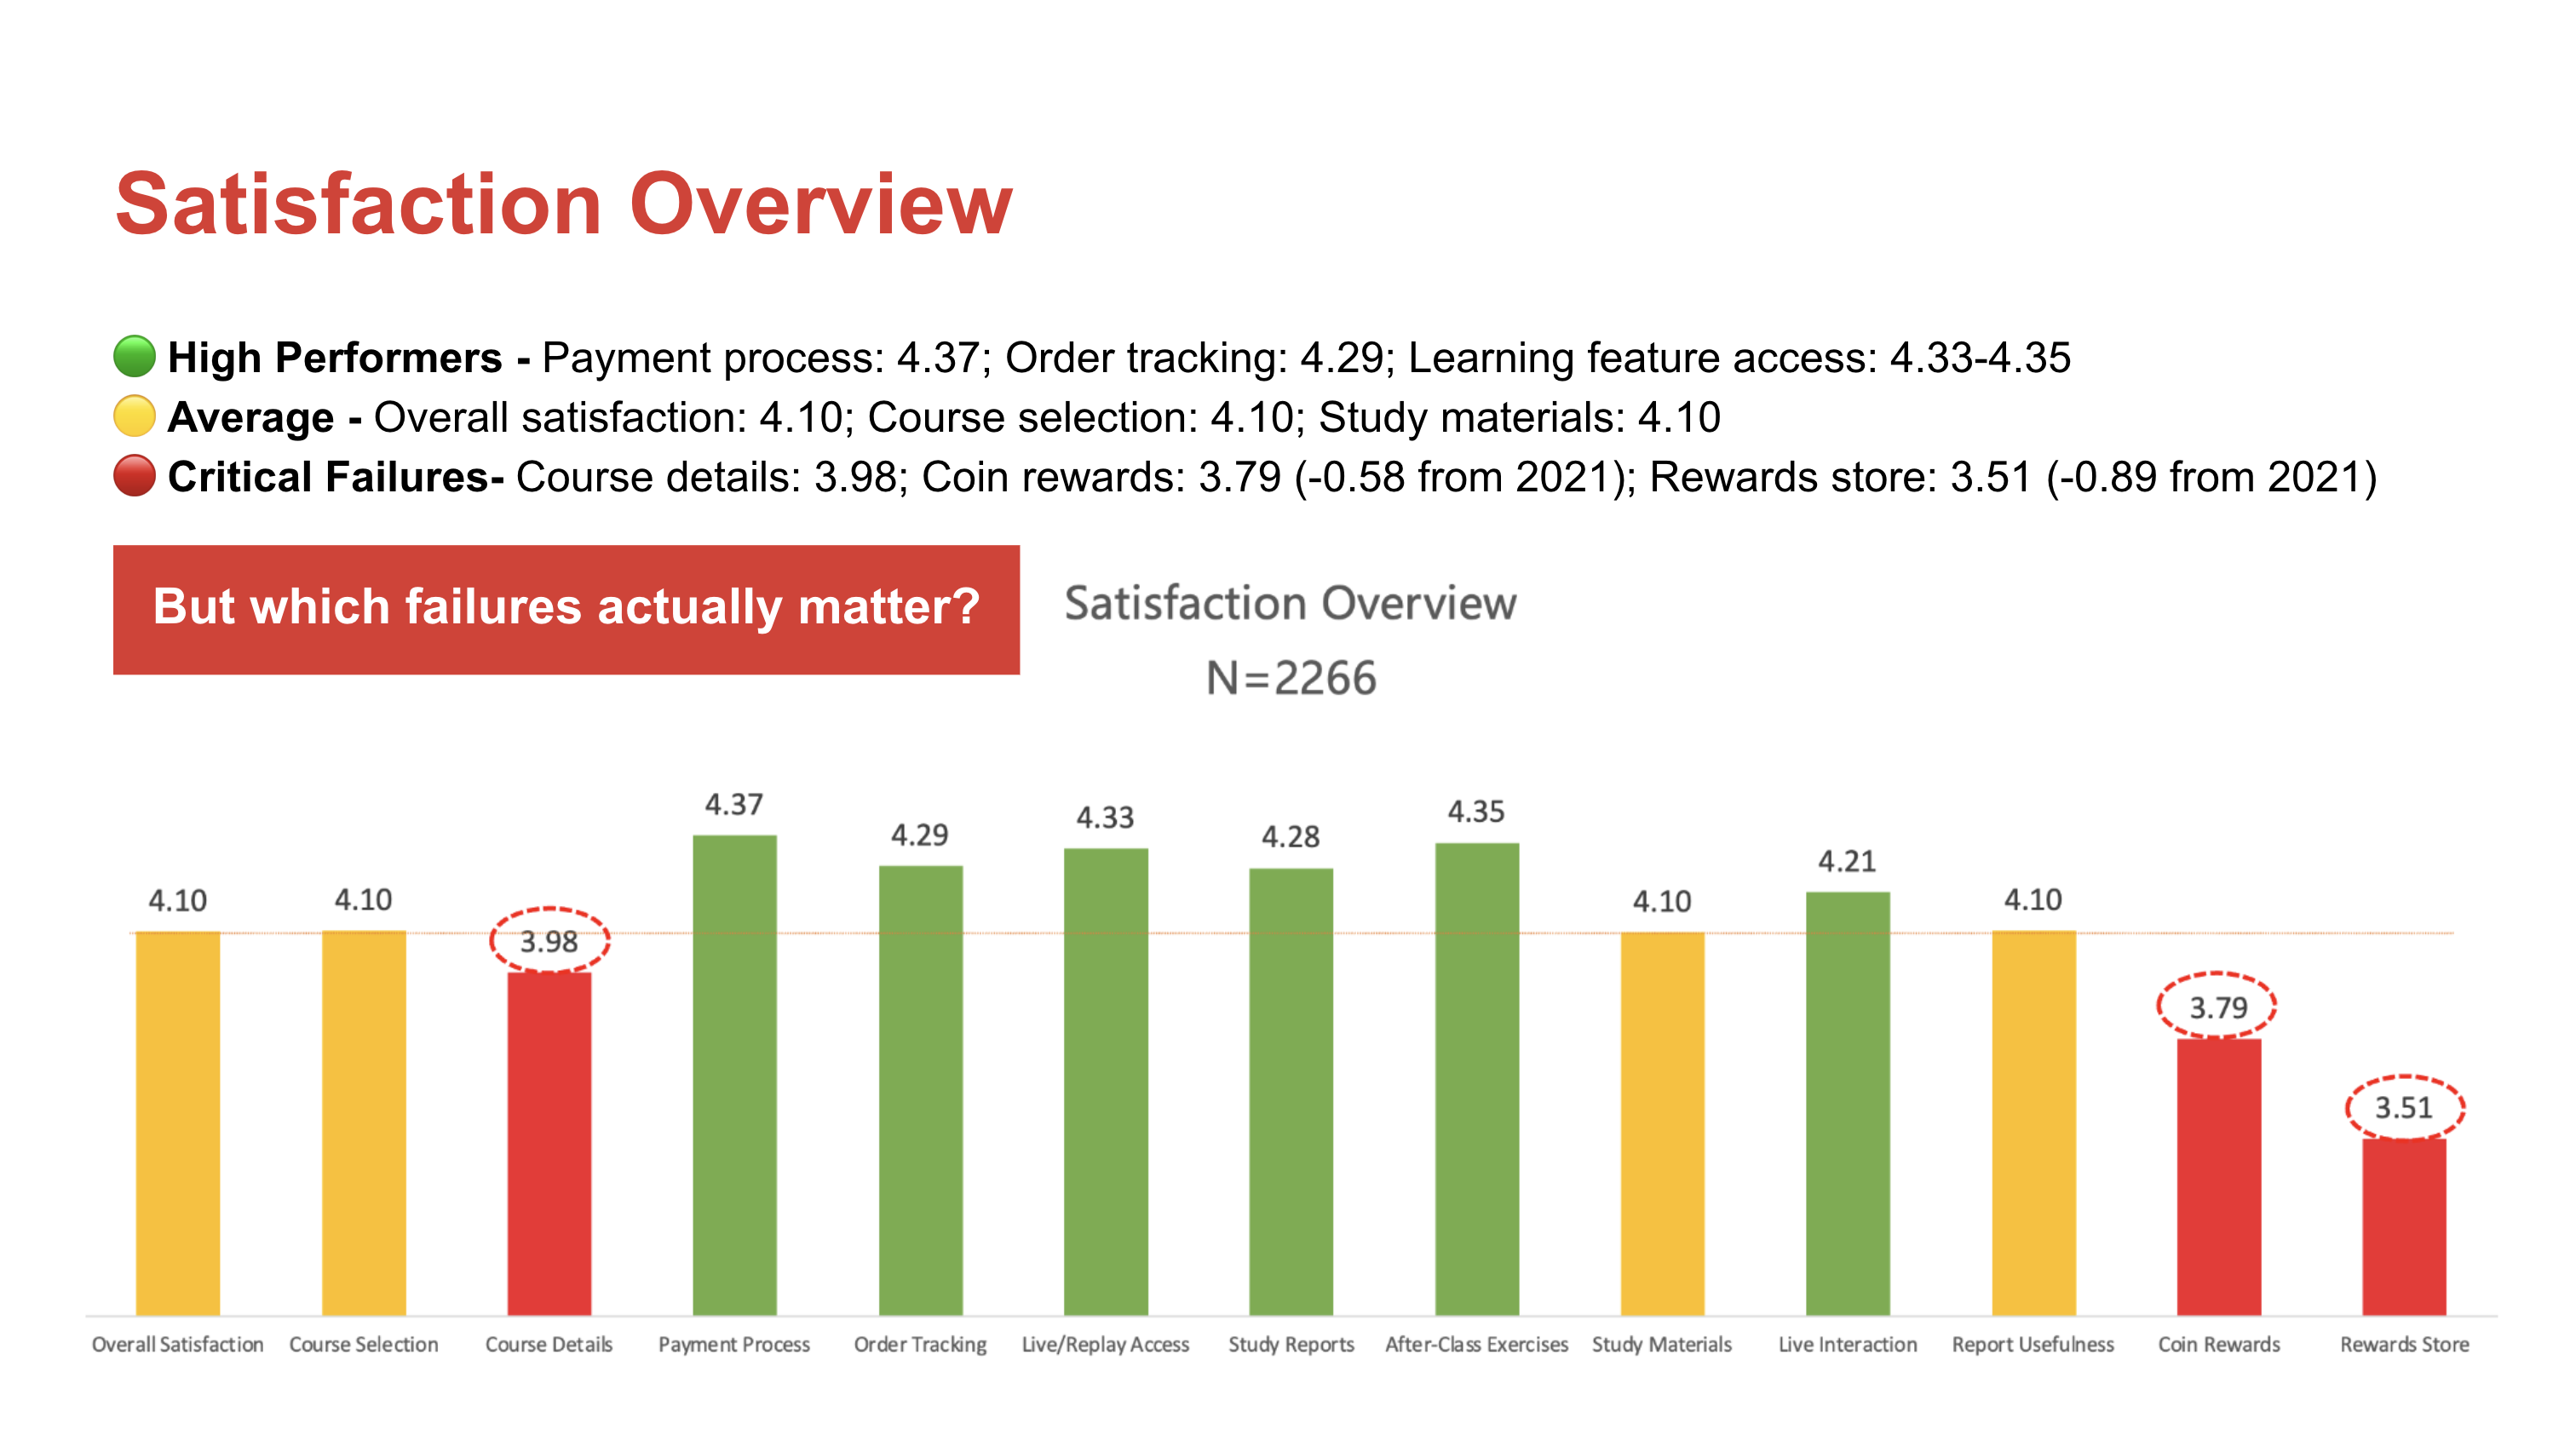
Satisfaction Overview
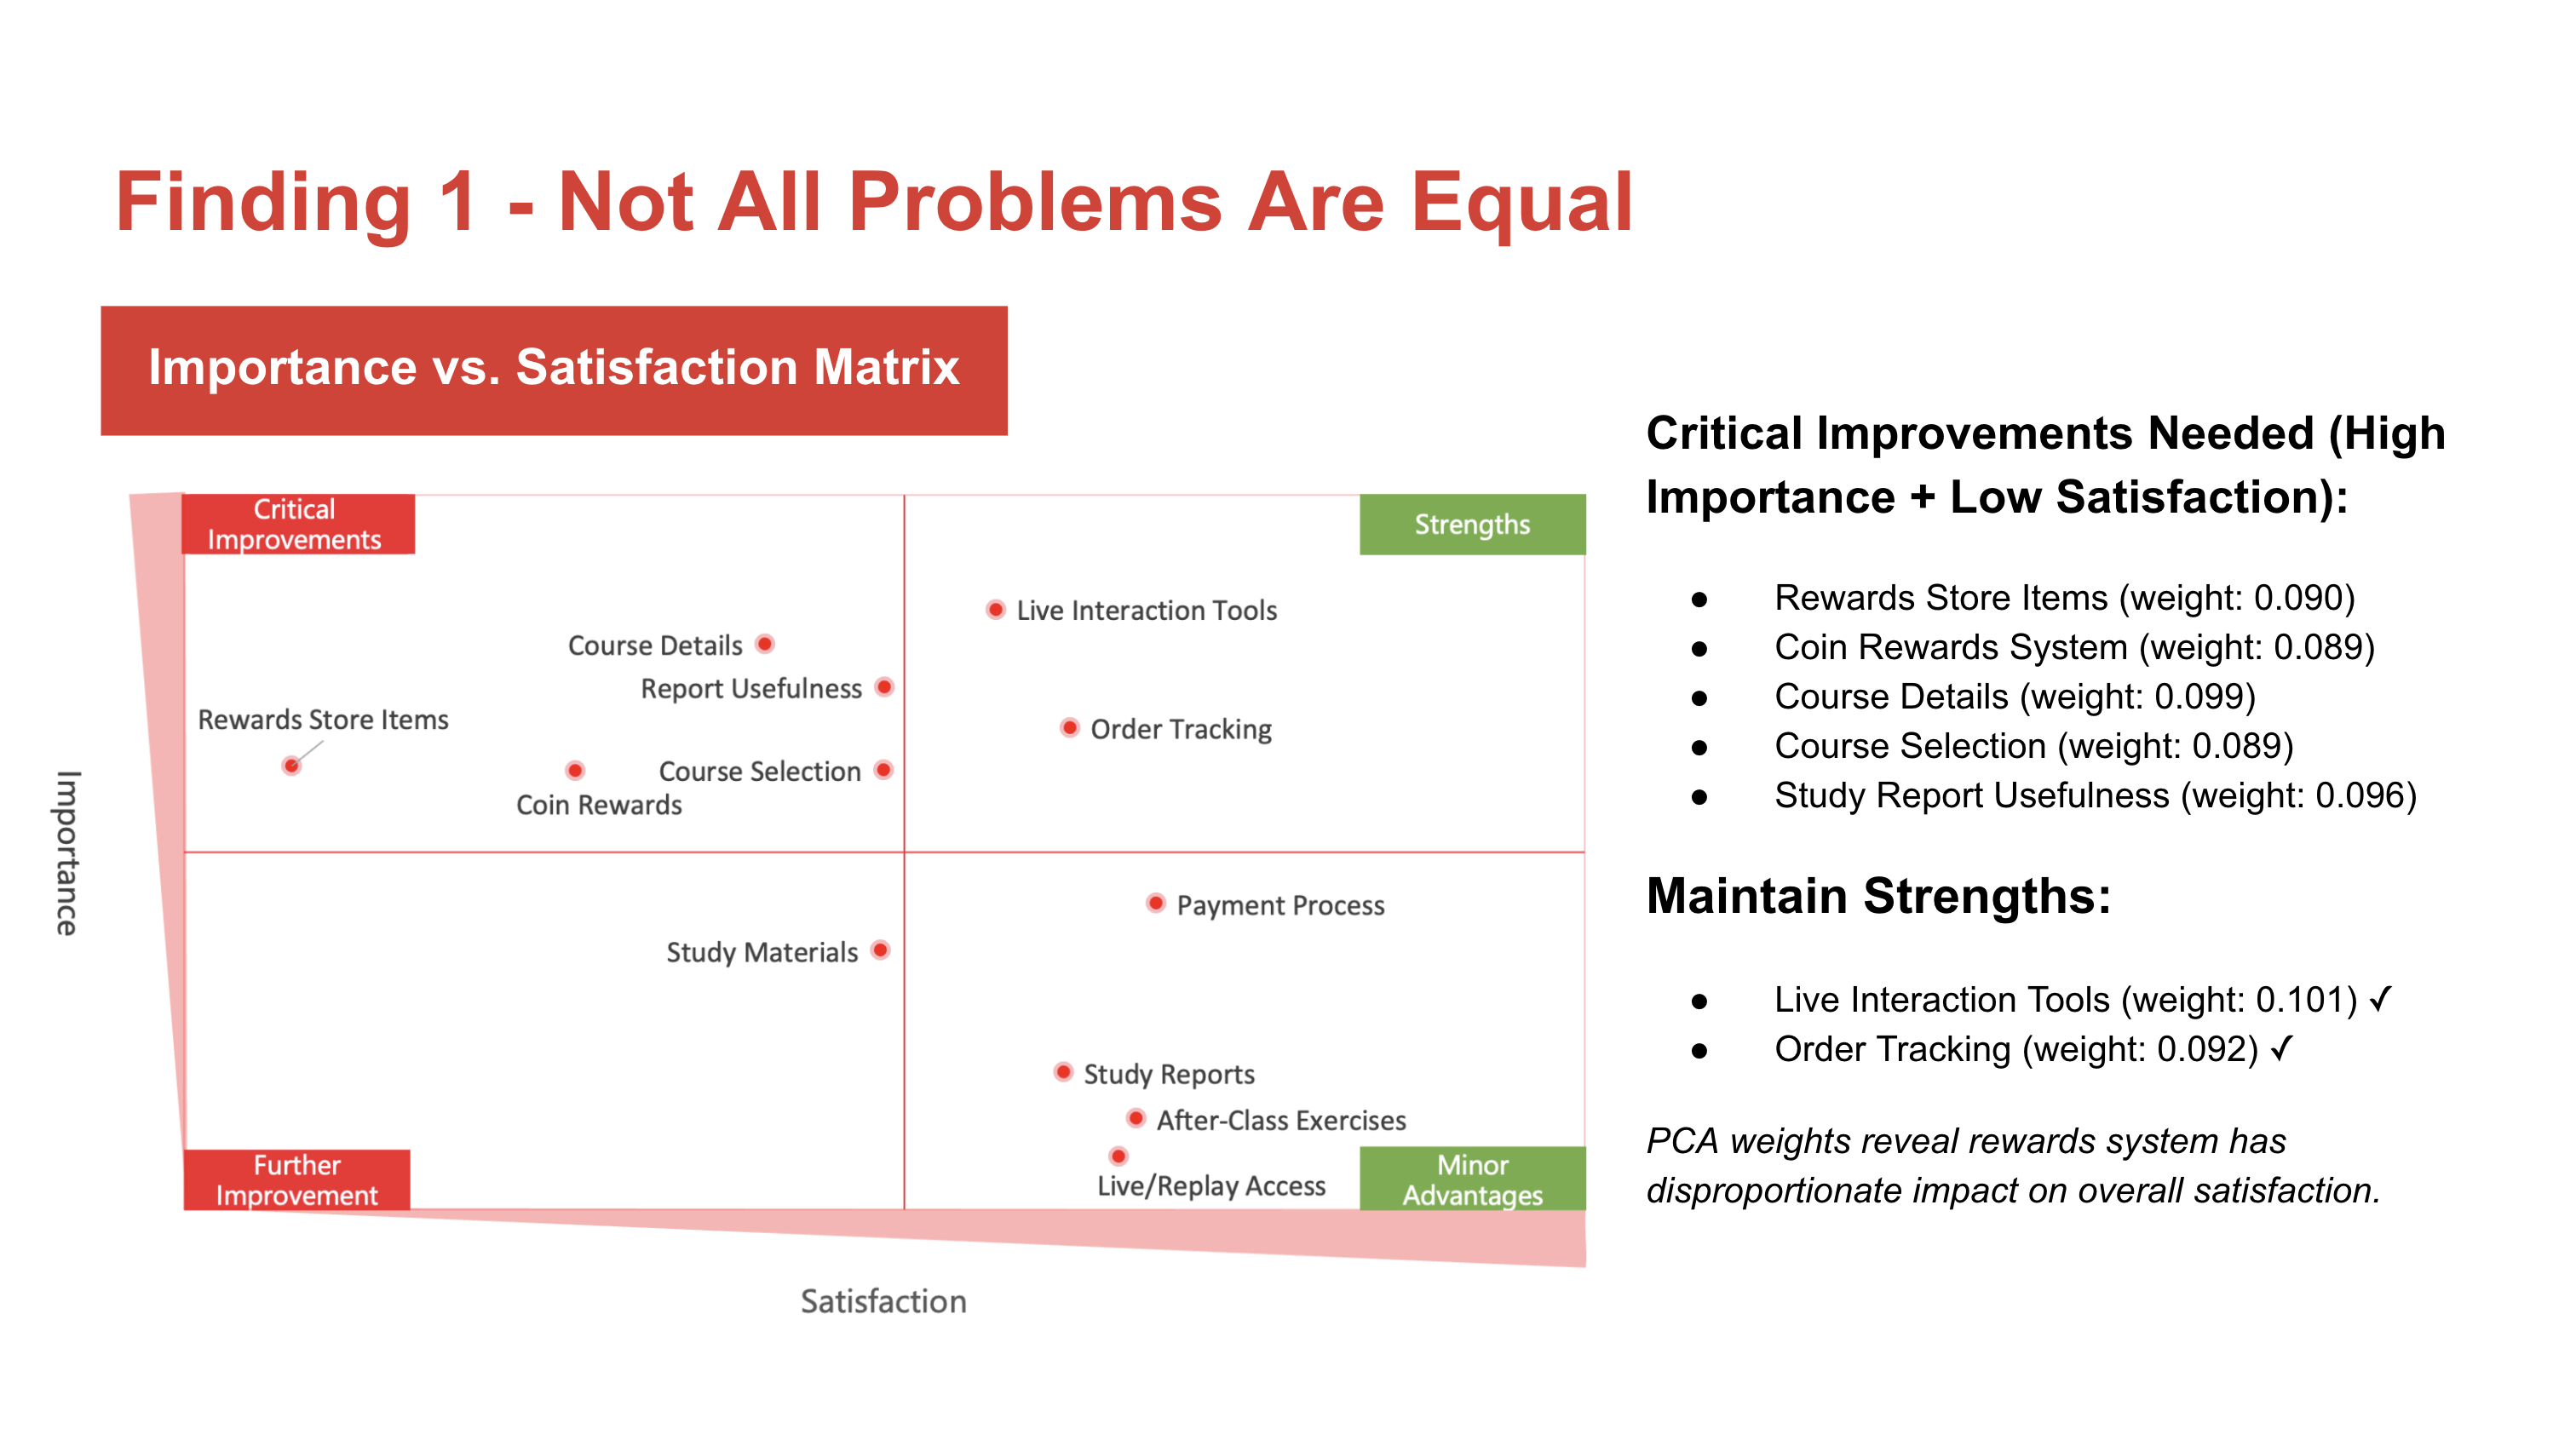
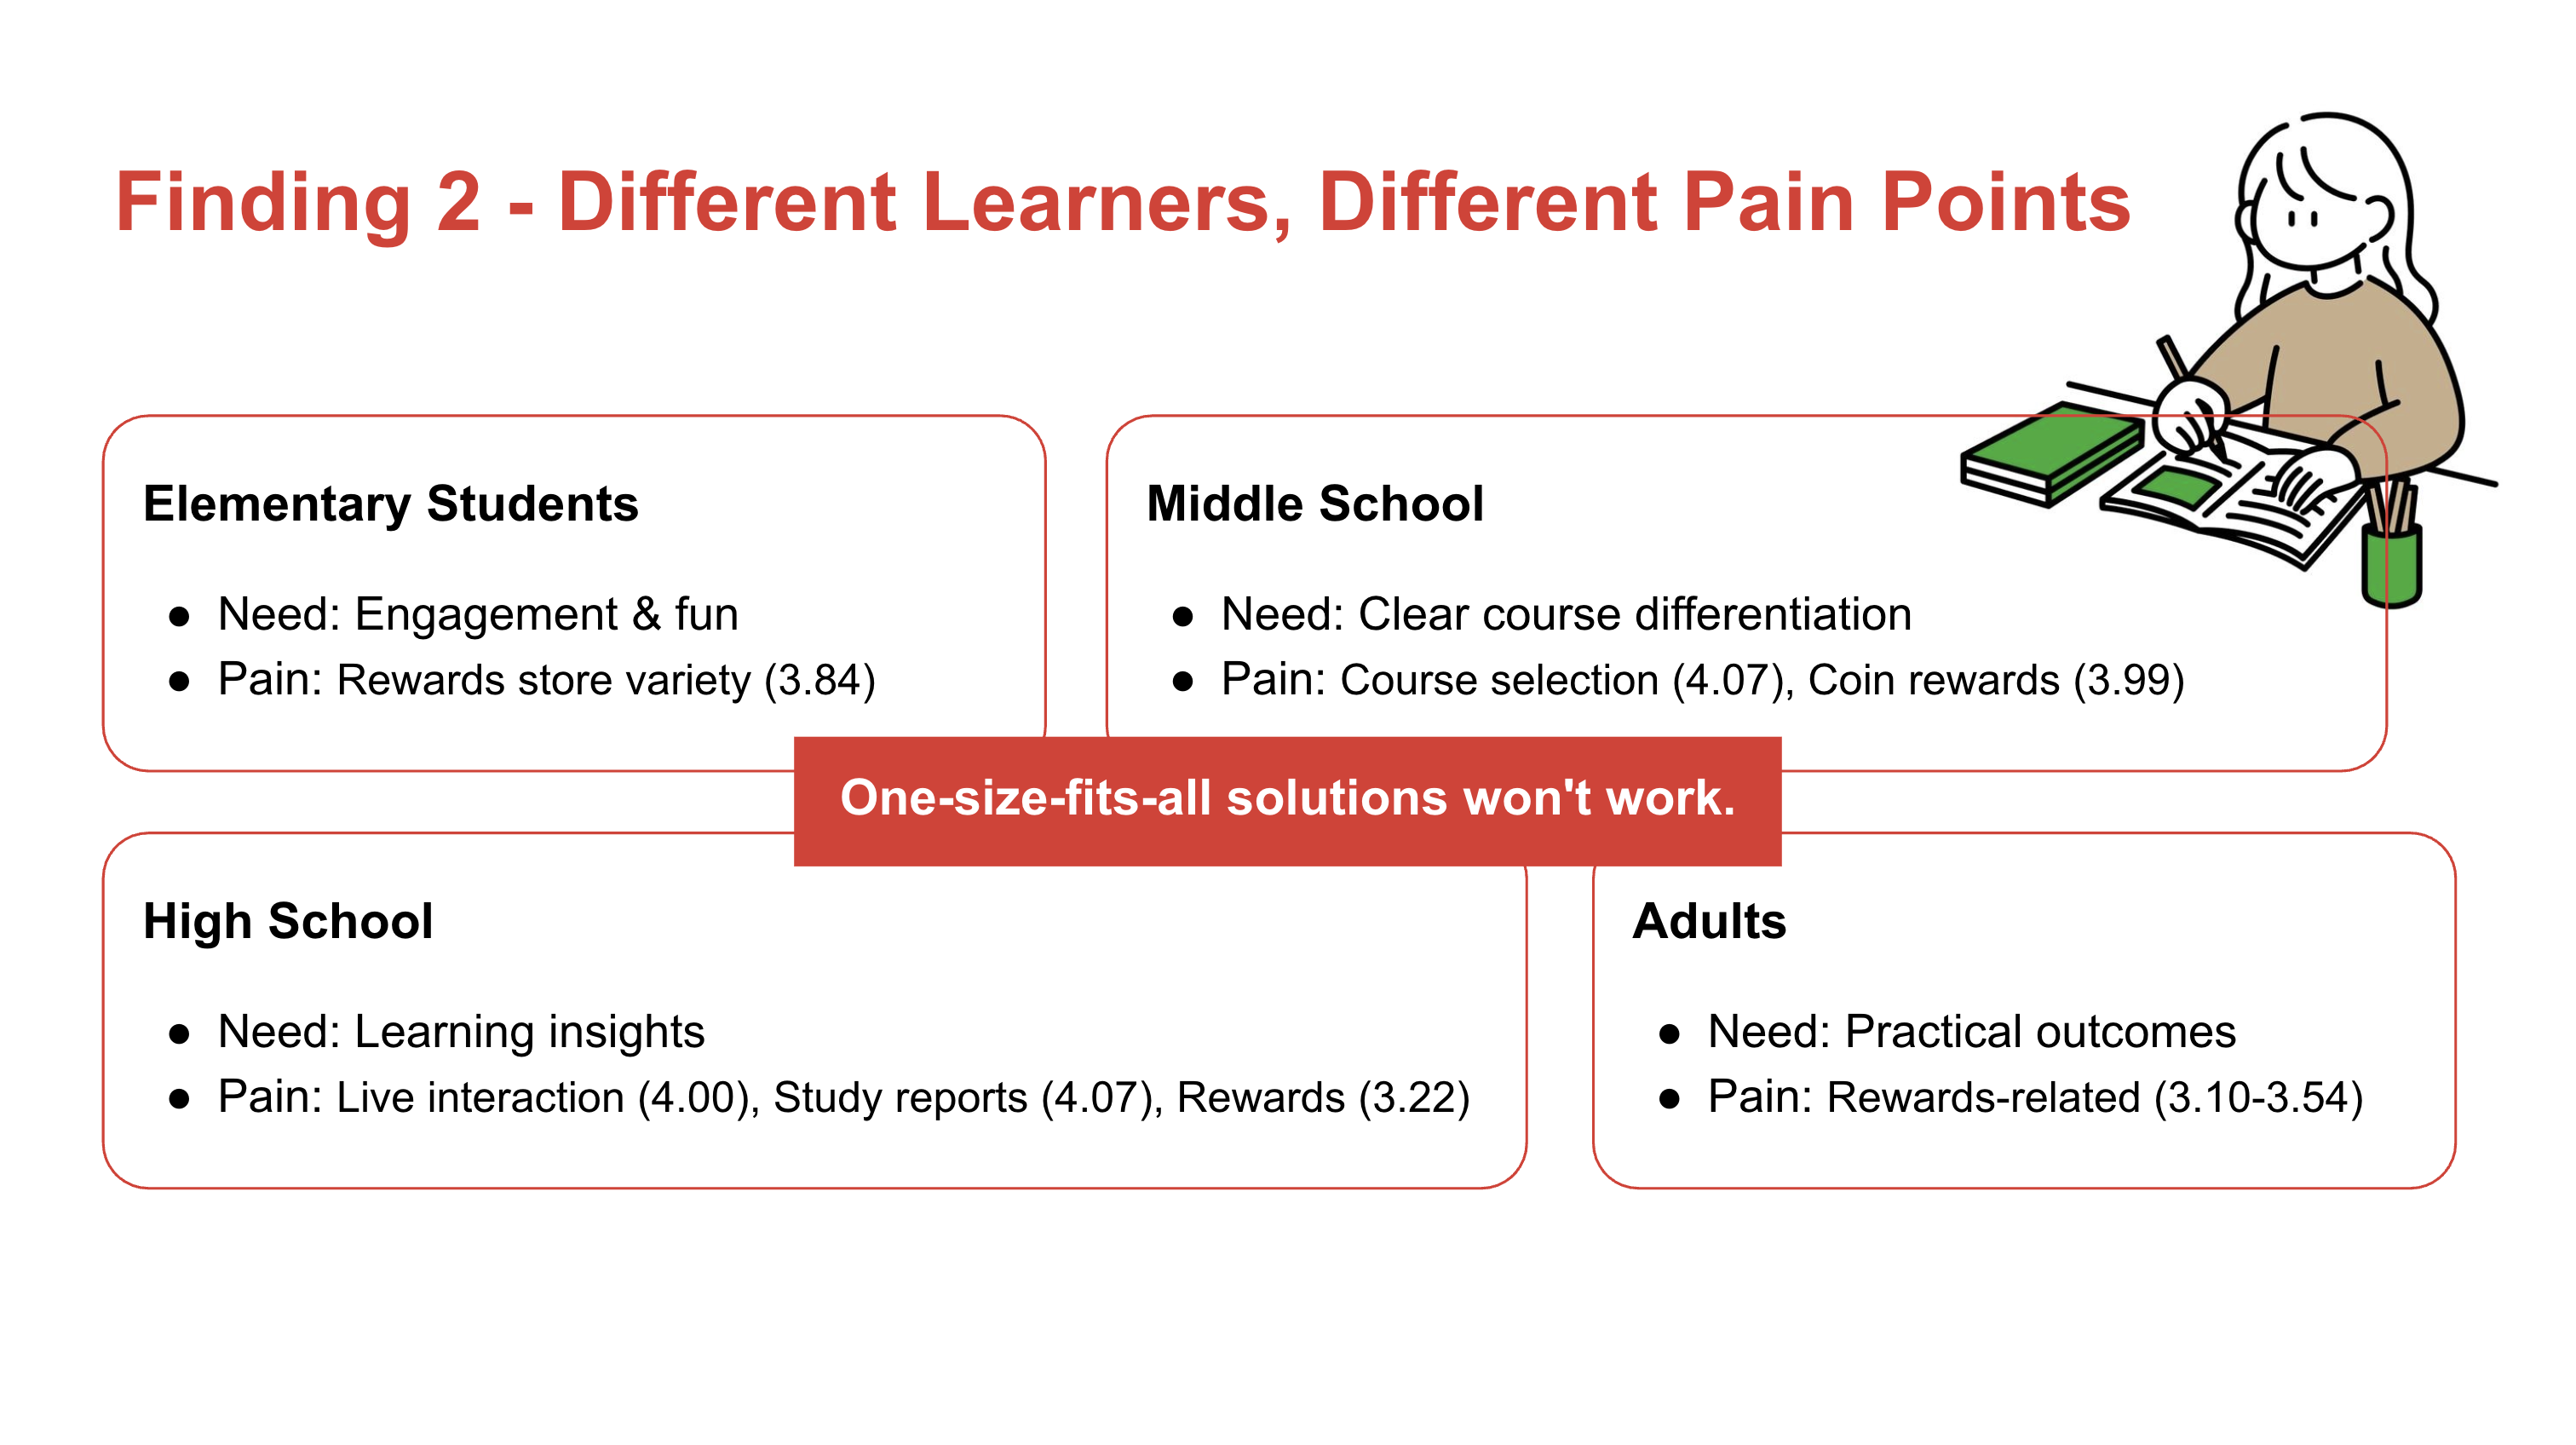
Key Findings
Recommendations
Reflection
Appendix
This section contains comprehensive survey analysis, statistical methodology details, and supporting evidence for the insights presented in the main case study.
A1. PCA Weights Analysis
Using PCA to calculate each feature’s relative importance in overall satisfaction (higher weight = greater impact)
| Rank | Feature Dimension | Weight | Visual Weight |
|---|---|---|---|
| 1 | Live Interaction Tools | 0.101 | |
| 2 | Course Details | 0.099 | |
| 3 | Study Report Usefulness | 0.096 | |
| 4 | Order Tracking | 0.092 | |
| 5 | Rewards Store Items | 0.090 | |
| 6 | Coin Rewards | 0.089 | |
| 7 | Course Selection | 0.089 | |
| 8 | Payment Process | 0.079 | |
| 9 | Study Materials | 0.076 | |
| 10 | Study Reports Access | 0.066 | |
| 11 | After-Class Exercises | 0.063 | |
| 12 | Live/Replay Access | 0.060 |
The top 3 features (Live Interaction, Course Details, Study Reports) account for 29.6% of total variance. Rewards-related features (ranks 5-6) have combined weight of 0.179, explaining why satisfaction dropped 8% when these deteriorated.
A2. Correlation Analysis
Spearman rank correlation coefficients showing relationship strength between satisfaction and behavioral outcomes
(p < 0.001)
(p < 0.001)
(p < 0.001)
(p < 0.001)
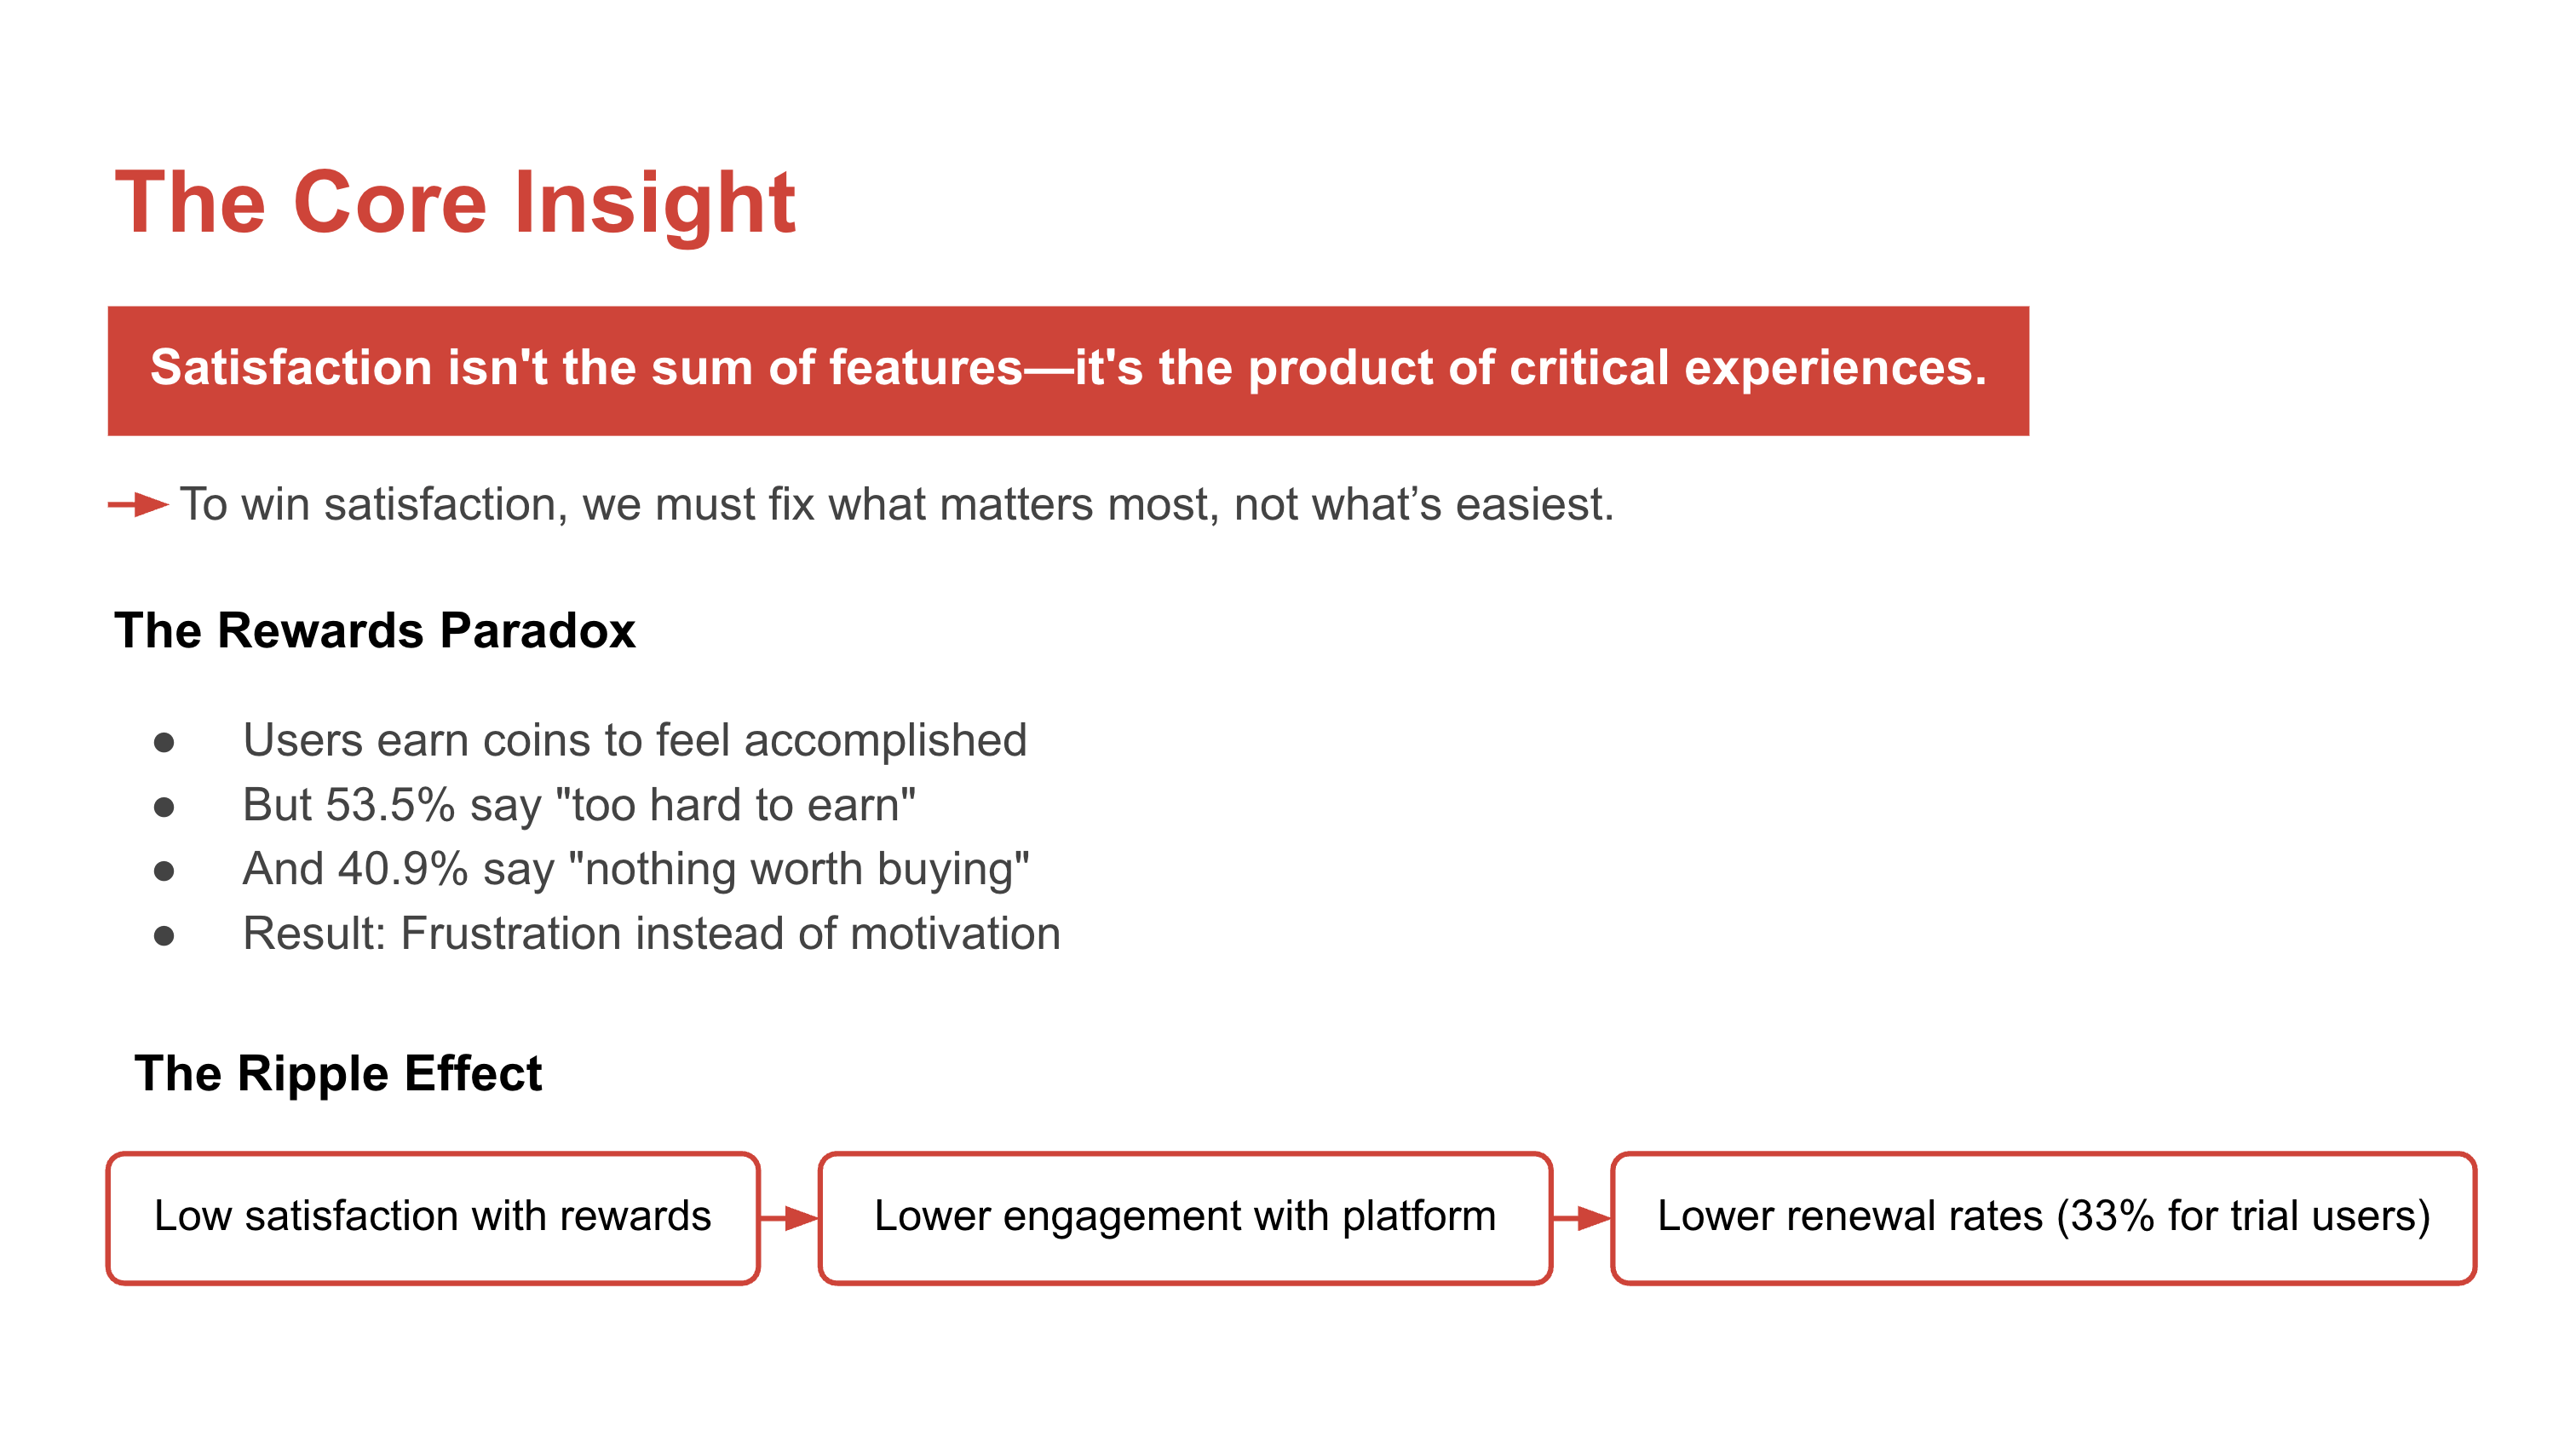
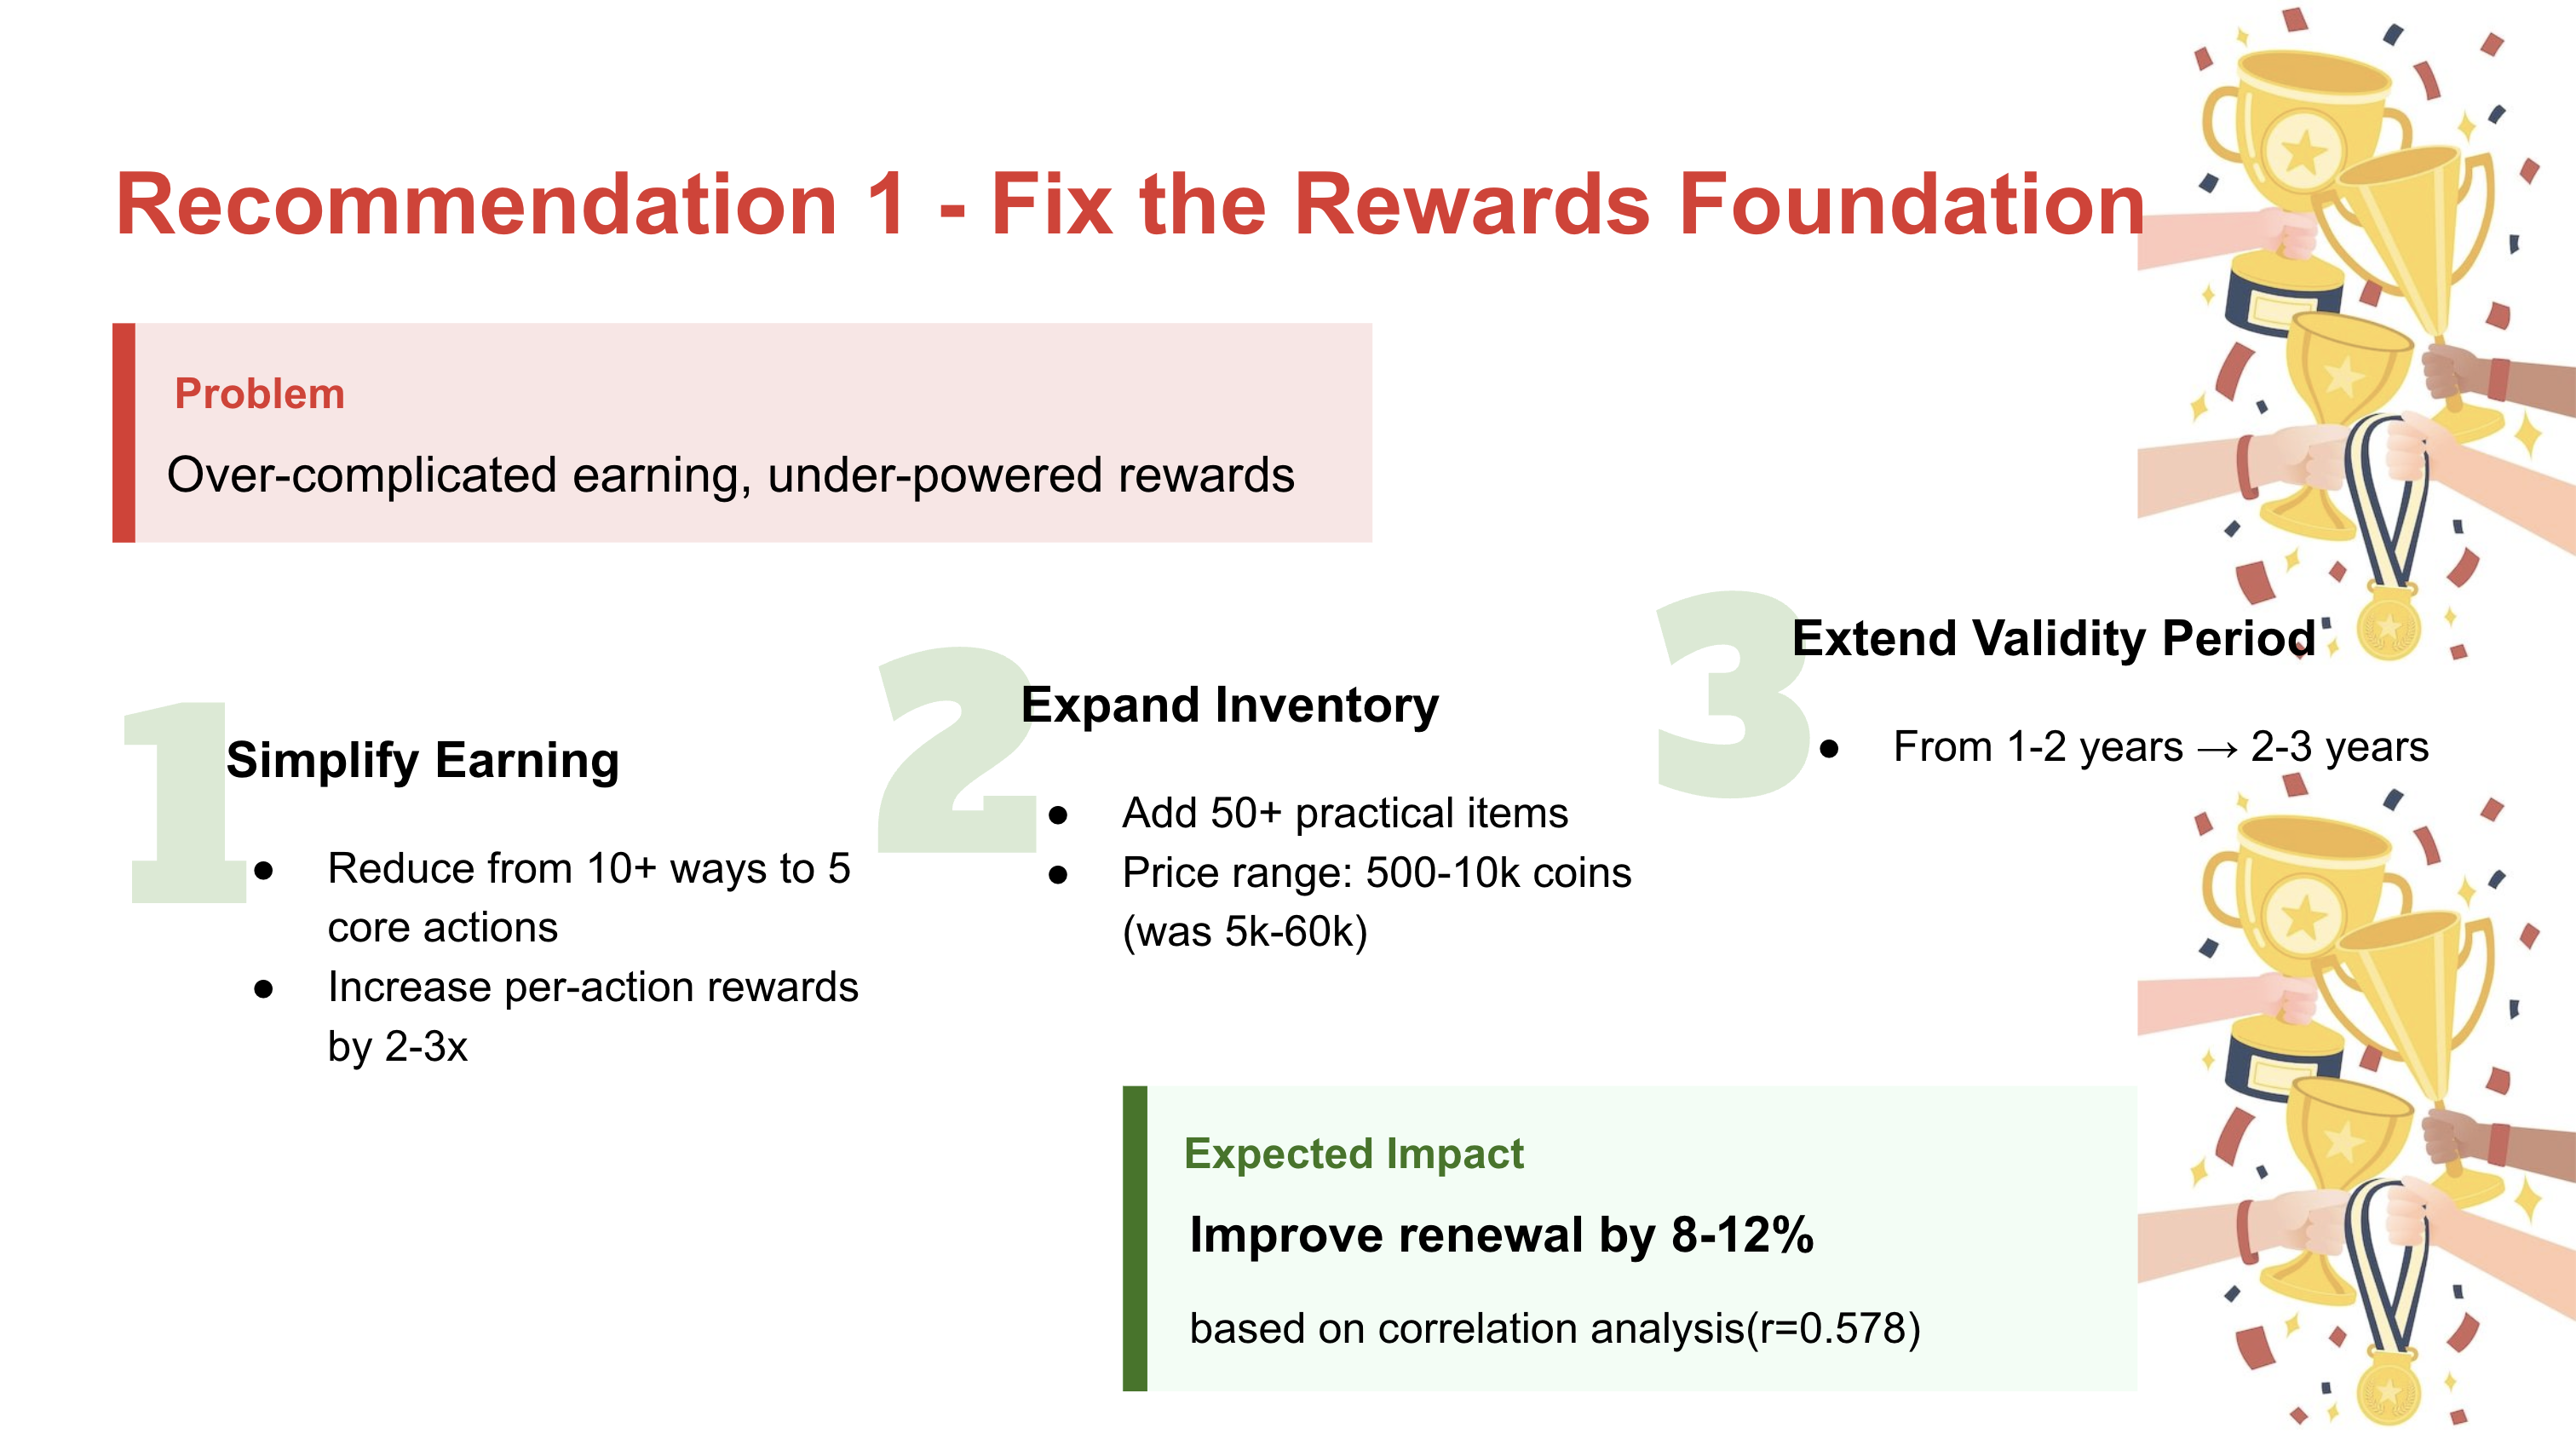
r = 0.578 between overall satisfaction and renewal intent confirms satisfaction is a meaningful predictor of retention. Every 1-point increase in satisfaction score corresponds to approximately 12-15% higher renewal probability.
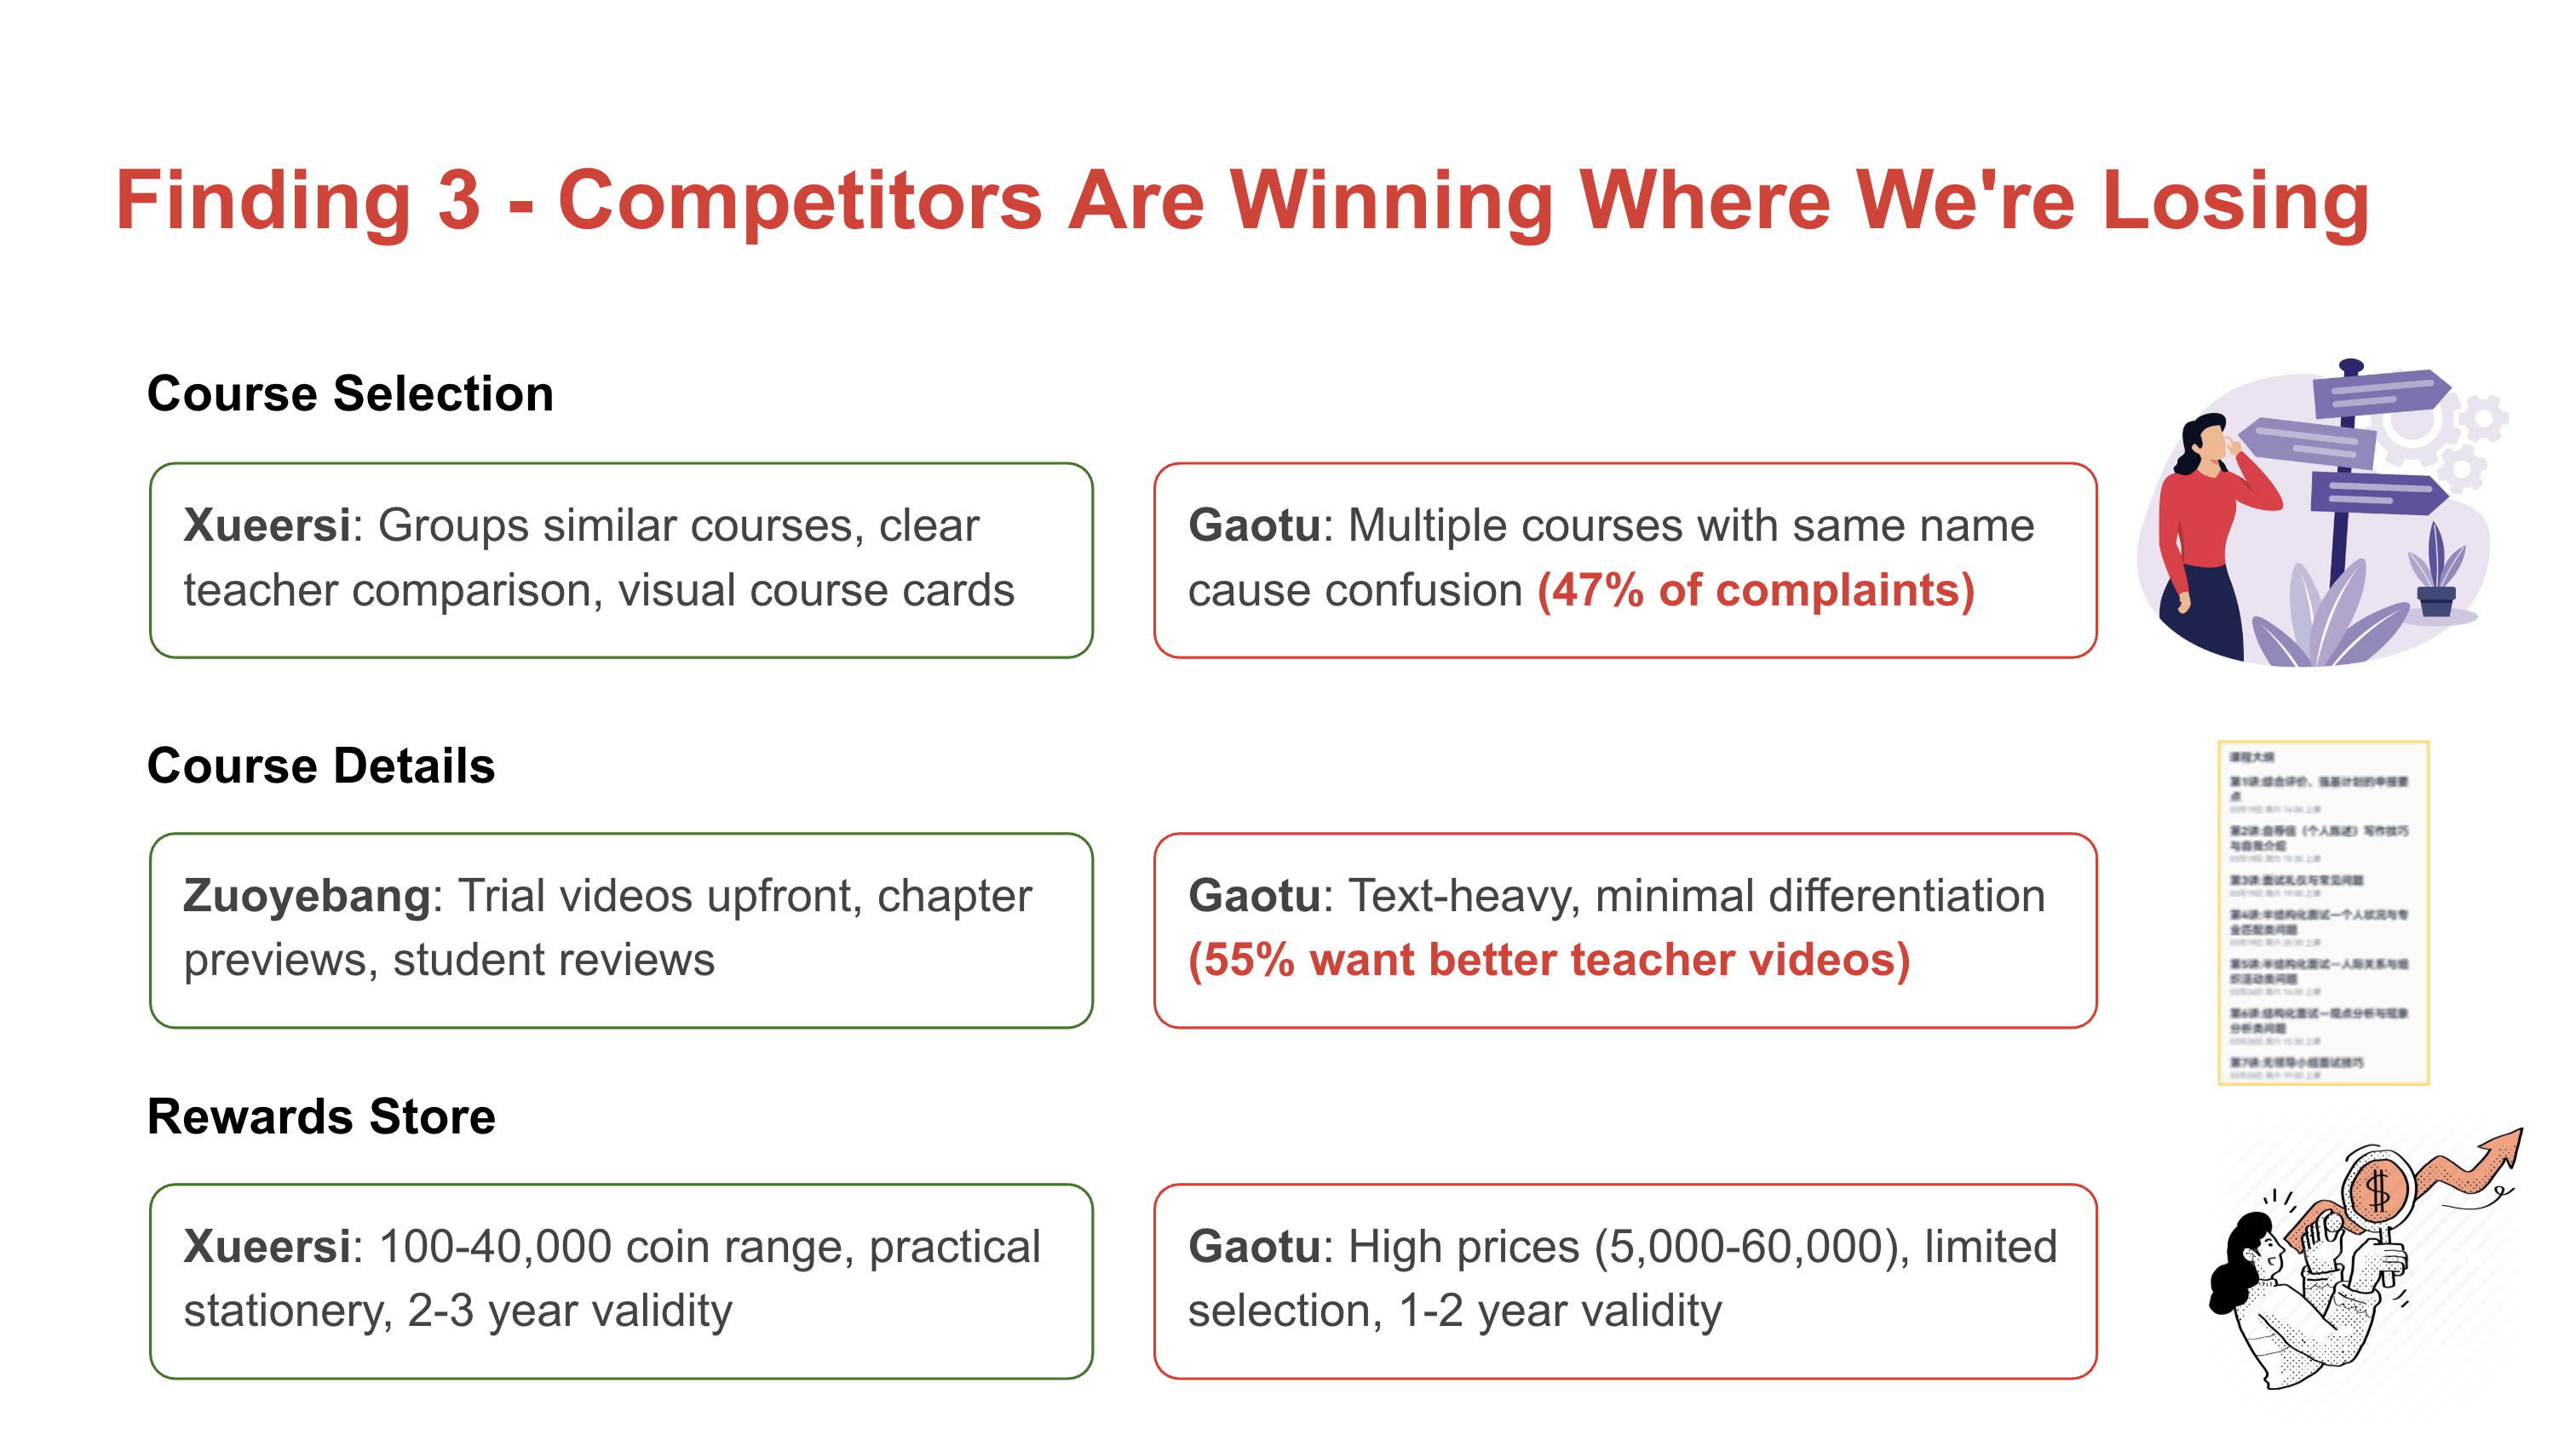
A3. Competitor Comparison
Head-to-head comparison of key features across major EdTech platforms
Gaotu lags competitors in 5 out of 7 key discovery features. 47% of users report confusion during course selection— directly tied to lack of grouping and comparison tools that Xueersi has perfected.